EPI

Next week’s 2024 Census data will give us the final snapshot of the economy’s health before Trump

The U.S. labor market continued to expand in 2024, but at a slower pace than the prior two years. Job growth remained fast enough to largely keep pace with population growth and wages rose faster than inflation. Upcoming Census Bureau data for 2024—set to be released on Tuesday—will reflect how these factors and others impacted annual earnings, income, poverty, and health insurance for workers, families, and children across the country.  

It’s worth emphasizing that the upcoming Census data do not reflect any economic developments in 2025. Some policymakers will attempt to claim any good news from the data as validation of the current U.S. policy path, but this would be completely misleading given the radical policy shifts in 2025 under the Trump administration. In this piece, we argue:

  • Data for 2024 will likely reflect continued labor market strength. Inflation decelerated rapidly in 2024, which should boost last year’s income growth. 
  • Even the likely strong 2024 income and poverty data will still show an economy that has left many workers, families, and children in an economically precarious position. Racial disparities in income, for example, leave people of color much more vulnerable to economic insecurity and poverty.
  • Trump administration policies—including chaotic and historically high tariffs, mass deportations, and attacks on the federal workforce—have already led to a softening labor market and more inflationary pressures in the economy. Given this, income and poverty measures are likely to worsen when these data are released next year for 2025.  
  • In 2026 and beyond, cuts to food assistance and Medicaid that were part of the Republican-passed spending bill will increase food insecurity and the number of people without health insurance, particularly for families of color.
  • The Census data are incredibly valuable and provide transparent and non-politicized data that allow Americans to make informed decisions about what policies are delivering economic security for working people. The Trump administration has begun attempting to politicize and erode trust in federal statistical agencies and to manipulate the reporting of anything that seems like bad news for the economy. This is deeply undemocratic.

The labor market mostly held strong in 2024 

Between 2021 and 2023, the labor market rebounded dramatically from the pandemic recession as large-scale policy interventions—like expanded unemployment insurance—helped families stay afloat and drove a recovery several times faster than the Great Recession. In 2024, the labor market remained relatively strong, growing by 2 million jobs over the year. The unemployment rate rose slightly but maintained a 4.0% average over the year. 

The prime-age employment-to-population ratio—the share of workers between the ages of 25 and 54 with a job—held steady at a high level of 80.7% in 2024. Prime-age Hispanic workers saw their employment rise, as prime-age Hispanic men increased their employment rates by 0.7 percentage points. Employment also rose slightly for prime-age Black and white women by 0.2 and 0.3 percentage points, respectively. At the same time, Black and white men experienced mild declines in their employment rates. 

Real (inflation-adjusted) wages continued to increase in 2024. Figure A shows that inflation fell sharply from 3.9% to 2.6% over the course of the year. At the same time, the strong labor market allowed workers to maintain a solid pace of nominal wage growth: nominal hourly wages and weekly earnings growth decelerated by much smaller amounts than price growth for goods and services. This combination of inflation falling faster than nominal wage growth is exactly the macroeconomic “soft landing” from the COVID-19 inflation shock that so many thought would be impossible to achieve. Together, this translated into a 1.4% increase in average real hourly wages over the year. Average real weekly earnings—perhaps a better signal for the annual income data out next week—rose by 0.9%. 

While these are meaningful averages, we also know that real wage growth was particularly strong for lower–wage workers and workers with lower levels of educational attainment. Along with steady employment, these advances bode well for improvements to income and poverty rates in next week’s report.

Figure AFigure A Persistent economic disparities leave families of color disproportionately vulnerable

The upcoming Census release will continue to show persistent racial inequities that can only be corrected through years of sustained progress. In 2023, typical Black and Hispanic households were paid just 63 cents and 74 cents, respectively, for every dollar paid to the median non-Hispanic white household. These disparities are especially harmful to low-income families of color who live in a constant state of economic insecurity. In a new report, we find that Black and Hispanic families with children make up more than half (61.1%) of economically vulnerable families, defined as those with incomes below 200% of the federal poverty line. Even within the group of economically vulnerable families, Black and Hispanic workers are also more likely to have incomes below the poverty line (see Figure B below). Narrowing these racial disparities will demand stronger and more persistent income gains for these families in the years to come.  

Figure BFigure B Policy changes are weakening the economy in 2025

There are several reasons to suspect that 2025 will be a worse year for incomes and poverty. For one, labor market indicators have weakened: unemployment inched up to 4.2% by July 2025, and job growth slowed to 85,000 per month compared with 168,000 in 2024. The last three months saw average job growth of just 35,000 per month. While layoffs have not yet surged, both employers and workers appear to be sitting tight in anticipation of a weaker economy going forward. Federal employment has fallen by 84,000 since January, which doesn’t include the many workers who will leave federal payrolls on September 30 at the end of the fiscal year. According to Trump official Scott Kupor, 2025 will end with 300,000 fewer federal workers.

The Trump administration’s damaging and chaotic tariff policy also threatens economic security, with nearly universal tariffs set at the highest level in a century or more. This is causing severe business uncertainty and already leading to higher prices for households because tariffs are taxes on both imported and domestically produced goods. Since lower-income families spend a higher share of their income on goods consumption, these tariffs will disproportionately harm their real incomes.

In addition, the administration’s mass deportation agenda will substantially harm the labor market. The damage will not just be felt by immigrant workers and their families—they will spill over and hurt U.S.-born workers as well. If the Trump administration successfully follows through on its goals of deporting 1 million people each year during their term, there will be 3.3 million fewer employed immigrants and 2.6 million fewer employed U.S.-born workers by 2029.

Health insurance coverage and access to food assistance will fall over the next several years

Health insurance, Supplemental Nutrition Assistance Program (SNAP) coverage, and Supplemental Poverty Measure (SPM) rates in 2024 will likely represent high-water marks over the next few years. That’s because the Republican spending bill passed in July cuts Medicaid spending by $793 billion and SNAP benefits by $186 billion over the next decade—all to pay for tax cuts for the richest Americans.

The share of the population without health insurance was 8.0% in 2023, or about 26.5 million people. This ranked near historic lows in the United States—driven by a strong labor market, enhanced Affordable Care Act (ACA) subsidies, and pandemic-era coverage protections (particularly in Medicaid). 2024 saw a slight rollback in some of the pandemic-era coverage protections, but the strong labor market and ACA subsidies likely kept uninsurance rates relatively low. However, we can expect uninsurance rates to climb in 2025 and beyond because the Republican spending bill both cut Medicaid and allowed the enhanced ACA subsides to lapse. This will lead to more than 14 million people losing health insurance coverage by 2035, increasing the number of uninsured people by more than 40%.1

The Republican budget will also lower incomes and increase food insecurity by cutting SNAP. Benefit reductions and more stringent eligibility requirements will reduce SNAP participation by an average of 2.4 million in the next decade. A weakening labor market will exacerbate this problem by making it more difficult to satisfy new SNAP work requirements as people work fewer hours due to shrinking job opportunities.

Black and Hispanic households will likely represent a disproportionate share of those losing health insurance coverage and access to SNAP benefits. Figure C below shows that people of color are more likely to rely on Medicaid and SNAP benefits. In 2023, SNAP lifted more than 3 million people out of poverty—over half of those were Black or Hispanic, and nearly 40% were children. Cuts to Medicaid, SNAP, and other government support programs mean that the 2024 rate of poverty as measured by the Supplemental Poverty Measure will also likely be the lowest for many years to come.

Figure CFigure C Timely and accurate data are essential but under threat

Next week’s release will also mark the last year in which data from federal statistical agencies could be reliably assumed to be completely free of politicization or manipulation. Staffing cuts and politically motivated firings at government agencies threaten the credibility of future data releases. On August 1,, Trump fired the Bureau of Labor Statistics Commissioner because he did not like the jobs numbers they released. High-quality public data inform how well the economy is delivering for the majority of working people—whether job opportunities exist, how families make ends meet, and whether families have access to vital services such as nutrition and health care. There is simply no substitute for the government data infrastructure, and pressure from the executive branch to alter data to fit political aims will damage a valuable public good that is critical for business decisions, policymaking, and planning by all stakeholders in the economy.

It is possible that the extreme competence and professionalism of federal workers who staff the statistical agencies will shield most of the data they release from manipulation or quality-erosion. But this will take near-heroic measures and is too much to ask of our civil service—they work hard enough collecting and analyzing this data in professional and non-politicized ways, they should not also have to be activists safeguarding its integrity.

Note

1. CBO projected that 32.4 out of 363.3 million people would be uninsured in 2034. Adding 10 million uninsured due to Medicaid cuts brings the uninsurance rate to 11.7%, compared with the actual 2023 uninsurance rate of 8.0%.

Don’t be fooled—U.S.-born workers are facing a worse labor market in 2025

It seems likely that the Trump administration will use Friday’s jobs report to continue to argue that their immigration policies are creating job market opportunities for U.S.-born workers, but this claim is false and based on a misreading of data from the household survey. If anything, the job market for U.S.-born workers is worse so far in 2025 than it was in preceding years. Analysts following demographic trends from the household survey should concentrate on unemployment rates and employment ratios, rather than levels.

The unemployment rate for the U.S.-born population is higher in 2025 than previous years (see Figure A). The July rate of 4.7% has not been this high since 2021. Similarly, the prime-age employment-to-population ratio for U.S.-born workers may be moving downwards and is certainly not consistent with booming employment (see Figure B).

Figure AFigure A Figure BFigure B

Although the monthly jobs reports estimate population or employment levels by U.S.-born or foreign-born status from the household Current Population Survey (CPS), using these estimates of levels to compare changes over time can be misleading, especially since the beginning of 2025. This is because CPS population levels and growth rates are adjusted once per year each January in order to reflect the best available population projections. Normally this adjustment has relatively minor effects, but the combination of a large January 2025 CPS population adjustment and Trump’s immigration policies are causing the size of the U.S.-born population to be mismeasured. Many economists have pointed out this concern, but it is worth reviewing in light of false claims that U.S.-born employment is surging.

Every year in January, the CPS adjusts population estimates by race and ethnicity, age, and sex. The adjustment causes level changes in the January 2025 population estimates for these groups and also predetermines population growth rates for the entire calendar year. In January 2025, these adjustments resulted in a large, measured population jump between December 2024 and January 2025 due to better information about immigration flows in previous years.

At the same time, because of Trump’s immigration policies, the measured share of the immigrant population is rapidly falling: immigrants are leaving the U.S. or entering at lower rates, and the climate of fear due to increased arrests, detentions, and deportations is making survey responses less reliable. For example, immigrants may be reporting that they are actually U.S.-born, or they may fail to respond to the survey at all. All of this has led to the measured immigrant share of the population falling in recent months.

But given that the total estimated CPS population size is predetermined each January, a measured decrease in share of the immigrant population will automatically result in higher U.S.-born population levels. The resulting spurious increase in estimated U.S.-born population levels then drives an increase in measured U.S.-born employment levels. This happens even as employment-to-population ratios, as shown before, show no corresponding increase. In essence, to claim credit for the rise in measured employment levels for U.S.-born workers in the face of a falling employment-to-population ratio, the Trump administration would have to prove their immigration policies were increasing the total U.S.-born population over a course of a few months—a clearly preposterous claim.

Indeed, another way to see that the measured U.S.-born employment increase is misleading is to observe that the number of U.S.-born nonworkers is increasing. Figure C shows that the number of U.S.-born people who are unemployed or not in the labor force increased sharply in 2025 and still increased in July, when the usual seasonal pattern shows a decrease in nonworkers. If Trump administration policies are leading to a boom in opportunity for U.S.-born workers, why are so many more U.S.-born workers not working in 2025? The answer, again, is that the measured CPS levels are highly misleading given pre-existing population counts. 

Figure CFigure C

These level changes are not to be relied upon for any serious analysis. Instead, analysts seeking to actually understand the current state of the labor market from the CPS should focus on unemployment rates and employment-to-population ratios. When properly focusing on these more accurate measures, it is clear that U.S.-born workers are facing a worse labor market in 2025.

Financial disparities will deepen economic insecurity for Black and Hispanic households amid the 2025 slowdown

Recent evidence from the Federal Reserve’s Survey of Household Economics and Decisionmaking (SHED) shows that disparities in income variability, hardship, and savings are deepening Black and Hispanic individuals’ vulnerability to economic insecurity. The Fed Board has conducted this survey annually since 2013, with a focus on capturing how households identify and assess the U.S. economy, their own economic wellbeing, and the potential risks that may impact their finances. The findings published earlier this year reflect the results of questions fielded in the last quarter of 2024, before the economic chaos wrought by the Trump-Vance administration increased fears of a recession.

An economic slowdown in 2025 is no longer just a potentiality. The economic mismanagement of the current administration—characterized by an erratic trade policy, mass federal layoffs and deportations, and an absolute lack of policy predictability—slowed the pace at which the economy and job market grew in the first half of the year. The large downward revision in payroll employment for May and June, for example, serves as a clear signal of a dimming labor market. With mounting evidence of a slowdown, workers of color and their families stand to yet again see their economic disadvantages compound. This is evident when we examine data pointing to Black and Hispanic families’ diminishing capacity to absorb a job loss or a broader economic downturn. 

Lack of dependable income leaves Black and Hispanic adults less financially secure and more exposed to hardship

Less than two in three Black (64.9%) and Hispanic (63.2%) adults reported “doing okay financially or living comfortably” near the end of last year (see Figure A). The financial standing of Black and Hispanic adults has moved in different directions since 2021. In 2021, both groups reported higher levels of financial well-being than in the preceding years. As is well-known, this was largely attributed to the economic relief measures that followed the pandemic with income, unemployment, and housing support. As these support systems quickly expired, Black adults managed to maintain some of their financial gains, largely as a result of the strong labor market recovery from the pandemic recession. But Hispanics didn’t report faring as well. In 2021, for example, the share of Hispanic adults who had reported “doing okay financially or living comfortably” was more than 7 percentage points higher than last year.

Figure AFigure A

Despite varying trends between Black and Hispanic adults, disparities between these groups and their non-Hispanic white peers have not narrowed since 2019. In 2024, for example, more than three in four (77%) white adults reported being in good financial standing. White adults also reported having less income variability than their Black and Hispanic peers. More than a third of Black (33.81%) and Hispanic (36%) adults reported having income that varies at least occasionally from month to month, compared with about one in four (26.45%) of their white peers. These disparate outcomes also follow broader disparities we observe in the labor market, as Black and Hispanic workers remained more likely than their white peers to be employed part time for economic reasons in 2024.

Black and Hispanic adults who report inconsistent monthly income at least occasionally are also significantly more likely than their peers to struggle to pay their bills. In 2024, more than two in five Black (43.27%) and Hispanic (46.30%) adults reported having difficulties paying their bills due to monthly fluctuations in income, compared with less than one in three (31.48%) of their white peers. These racial disparities have existed since before the shock of the pandemic. The disproportionate exposure of Black and Hispanic adults to financial hardship given short-term income fluctuations in the face of a strong economy means that these individuals and their families are vulnerable to even more hardship as economic growth and employment wane in 2025.

Economic insecurity leaves Black and Hispanic adults without enough savings to absorb the shock of an economic downturn or life emergency

The Federal Reserve’s SHED typically asks survey respondents about their access to a “rainy day” fund consisting of sufficient savings to cover three months of living expenses in the event of a job loss or an emergency. This question is typically used to assess the financial resilience and economic security of respondents. In 2024, only slightly more than two in five Black (41.43%) and Hispanic (44.14%) adults reported having enough savings to absorb the shock of a job loss (see Figure B). In contrast, three in five non-Hispanic white adults reported having sufficient savings to cover three months of expenses. The financial resilience of Black and Hispanic adults has not changed dramatically since 2019.

Figure BFigure B

The disproportionate fragility that Black and Hispanic adults face in the event of an emergency is even more severe than the access to a rainy day fund may suggest. This is evident when we consider the ability of these individuals to cover an unexpected $400 expense with cash, savings, or a credit card that they are able to pay back in full by the next statement. While 71% of non-Hispanic white adults were able to cover a $400 emergency with cash or its equivalent last year, less than half of their Black and Hispanic peers reported having this financial cushion (see Figure C). While the share of Black and Hispanic adults who could cover a $400 emergency “with cash or its equivalent” has fallen since 2021, their relative disadvantage has endured since 2019. Despite a growing economy last year with low unemployment and rising wages, these individuals and their families stood one unplanned expense away from deepening economic uncertainty and pain.  

Figure CFigure C A weakening labor market will hurt all, but communities of color will once again bear the brunt of the impact    

Recessions have historically been especially harmful to communities of color. In each business cycle downturn over the course of the last four decades, Black and Hispanic workers have experienced a significantly larger fall in employment than their white peers. When the employment situation of these workers of color deteriorates as a result of a contraction, it also takes them longer to recover than their white peers. This can lead to painful scarring effects that disadvantage workers already more likely to suffer joblessness than their white peers even when the economy is growing and inflation is tamed.

Trump is the biggest union-buster in U.S. history: More than 1 million federal workers’ collective bargaining rights are at risk

Since Inauguration Day, the Trump administration has taken a flurry of actions that have put our federal agencies, economy, and democracy at risk. One alarming line of attack that directly threatens workers’ economic security has been on labor unions and workers’ right to engage in collective action. 

For decades, large corporations and unscrupulous employers have undermined workers’ right to collective bargaining. But throughout this period, the federal government has largely recognized the existence of these rights and respected the independent bodies that enforce our labor laws. No more. Trump has tossed aside the rule of law and advanced a strategy to not only weaken but effectively eliminate many workers’ ability to engage fully in collective action and bargaining. Below are some of Trump’s most egregious actions so far.  

Union-busting the federal workforce. In March, Trump issued an executive order that stripped union protections from more than 1 million federal workers across dozens of federal agencies. And in advance of Labor Day, Trump issued another executive order expanding these actions to additional agencies. Despite ongoing litigation, some agencies have unilaterally canceled collective bargaining agreements with the unions that represent its employees. For example, the Department of Veterans Affairs announced in early August that union contracts for 400,000 employees were terminated, eliminating crucial protections for federal workers. 

As the federal workforce continues to be under attack, unions are crucial to protecting these workers’ jobs and ensuring a fair transition and compensation in the event of large-scale downsizing at agencies. Trump’s action represents the single largest retaliatory action against unions and workers and sends an alarming signal to employers across the country. Trump cited thinly veiled national security reasons to pursue these blatantly retaliatory actions against unions that were fighting back against Trump’s attack on the federal workforce. The federal government should be modeling high-road employer practices. Instead, Trump has implemented the most egregious union-busting tactics and normalized illegal actions for private-sector employers across the country. 

Stacking the National Labor Relations Board (NLRB) in his favor. In January, Trump fired NLRB Chair Gwynne Wilcox and severely jeopardized the independence of the agency. When Trump fired Wilcox, he cited that her opinions on the Board had “unduly disfavored” employers—an implicit warning about how any future Board members should rule if they want to keep their jobs. 

With only two members remaining on the Board—and therefore unable to meet quorum—the NLRB cannot hear cases on unfair labor practices or union representation, nor can it issue decisions. While Wilcox continues to fight her firing in court, Trump has nominated Scott Mayer and James Murphy to be Board members. If confirmed, the NLRB would have enough members to establish a quorum and a Republican majority. If Mayer and Murphy are confirmed, workers and unions are likely to find their cases ultimately before a Board that is heavily influenced, if not controlled by, Trump and the interests of bosses over workers.

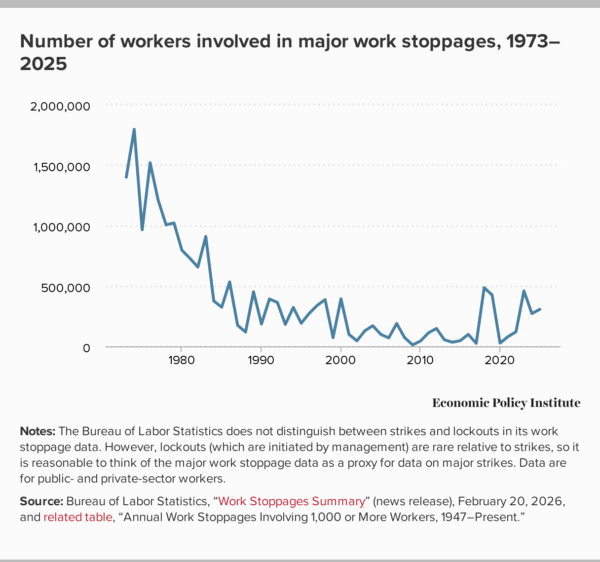
Undercutting efforts to foster and support labor-management mediation. In March, Trump directed the Federal Mediation and Conciliation Service (FMCS) to eliminate “non-statutory components” and to “reduce the performance of their statutory functions and associated personnel to the minimum presence and function required by law.” Since 1947, the FCMS has helped resolve difficult labor disputes, especially those that have resulted in strikes. There is a clear interest for the federal government to encourage parties to continue engaging in the collective bargaining process: workers who go on strike can experience economic hardship and broader economic impacts may be felt. Trump’s directive to undermine the FMCS, however, signals to employers and labor the exact opposite. At a time when employer power usually far outweighs worker power—and unions struggle to secure first-time contracts—Trump’s actions may have a significant chilling effect on workers’ ability to get employers to engage in good faith at the bargaining table. 

In the coming months, we will no doubt continue to see more attacks undermining workers’ right to organize and collectively bargain. You can find a comprehensive catalogue of all policies relevant to working people and the economy at Federal Policy Watch, an EPI online tool documenting actions by the Trump administration, Congress, federal agencies, and the courts.