
With each unemployment report release, pundits and press quote various unemployment rates ranging from 9.1% to 22.7%, and announce that is the real unemployment rate. What does that mean and how are they getting those other numbers?
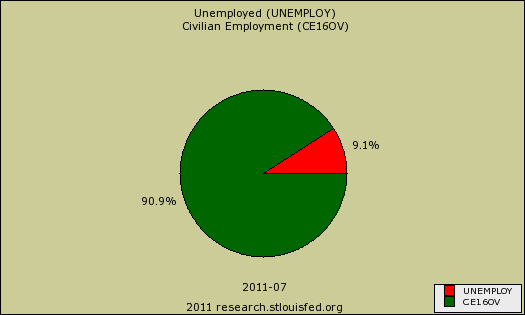
First, the unemployment rate is well defined, a ratio and been set since 1994 by the same methods. The official unemployment rate is 9.1%. There are 13,931,000 official unemployed people in July 2011.
Yet the BLS gives an additional number, those who are not part of the labor force who want a job, currently 6.57 million people, and this group isn't part of the official unemployment rate.
Then there is yet another group of people who really want and need full time jobs who can only get part time ones. These people number 8,396,000.
To make matters worse, one hears the broader definition of unemployment is 16.1%.
The Civilian Labor Force and those considered not in the Labor Force, together, add up the non-institutional civilian population. The non-institutional civilian population are those persons 16 years and over, not in the military, locked up somewhere, hospitalized or in nursing homes. Below is a graph of the two categories which make up the non-institutional civilian population.
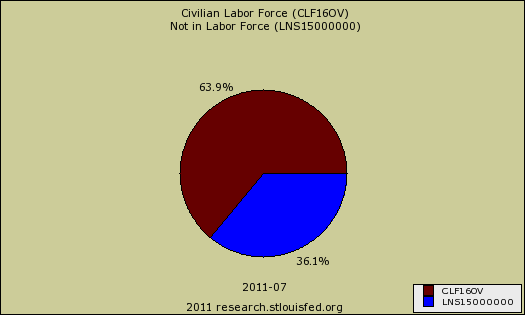
Then of those in the civilian labor force are two categories,the employed and those officially out of a job and looking, or the unemployed.
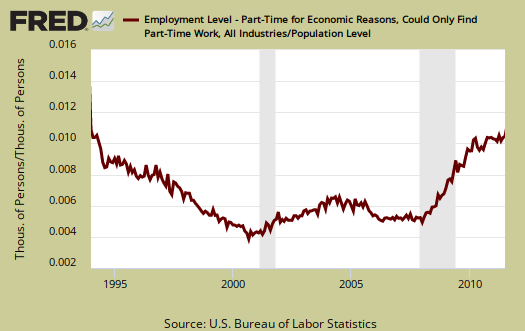
Below is the graph of those part-time, who are considered part of the labor force, employed, who could only find part-time work, divided by the monthly non-institutional civilian population. Even though population monthly increases are not seasonally adjusted and additionally have a yearly adjustment made between December and January, a pattern is clear, more and more people are being forced into part-time jobs.
Then, there is yet another measure, which comes from the category, not in the labor force. There are those not in the labor force who actually want a job. Within those not counted as part of the labor force who really want a job is yet another subgroup the marginally attached. The marginally attached are people not counted, considered not in the labor force, who actually looked for a job in the last year.
The BLS definition of marginally attached workers is:
Persons not in the labor force who want and are available for work, and who have looked for a job sometime in the prior 12 months (or since the end of their last job if they held one within the past 12 months), but were not counted as unemployed because they had not searched for work in the 4 weeks preceding the survey. Discouraged workers are a subset of the marginally attached.
A highly cited alternate measure of unemployment, or broader measure of unemployment is called U-6. What makes up U-6 is listed below:
Total unemployed, plus all persons marginally attached to the labor force, plus total employed part time for economic reasons,as a percent of the civilian labor force plus all persons marginally attached to the labor force.
U-6 is currently 16.1%. U-6 is often referred to as a broader measure of unemployment. Below is a graph of U-6.

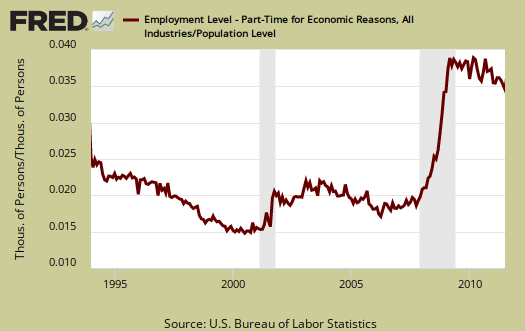
Graphed below are total part-time workers for economic reasons. They are working in part-time for either they had their hours cut back or they could only find a part-time job. In other words, they aren't working part time out of choice. This group is again divided by the non-institutional population, flawed as that monthly rate comparison is, to see the overall pattern. What we see is this has never been higher, including 1994, which the United States was still affected by a recession and jobs were scarce.
Below is a graph of the total reported people who want a job, who are not part of the labor force. The marginally attached is a subset of this group. The group is presented as a percentage of the monthly non-institutional civilian population.
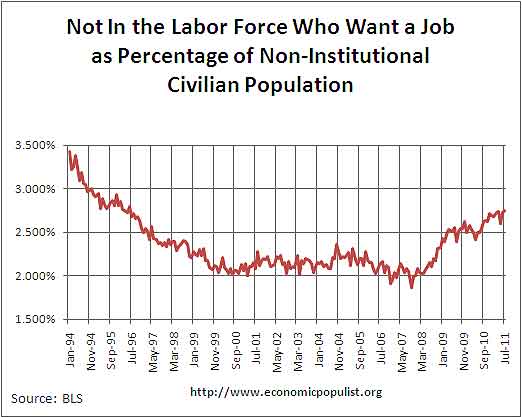
As we can see this group as a percentage is fairly consistent and also was much higher in 1994. It has ticked up around 2008, but it doesn't have the dramatic increase that people shunted into part time jobs when they need full time has.
Currently the unemployed are 13.931 million, those who are employed, yet part-time for economic reasons are 8.396 million. Now, instead of using marginally attached, which is people not part of the labor force who actually looked for a job in the last year and derive U-6, let's add all of those not in the labor force who reported wanting a job, currently at 6,575 million. The marginally attached are part of these 6,575 million people. If you add of of these groups together, it becomes 28,902,000 people wanting a full time job, or any job. The non-institutional civilian population is 239,671,000.
What happens then to the unemployment rate if we include those who are not counted, not part of the labor force yet report they want a job? The problem with this calculation is one must add those 6.575 million to the civilian labor force (or the employed and official unemployed) in the denominator for this ratio to be valid. The civilian labor force for July 2011 was 153,228,000.
The July 2011 unemployment rate for those officially unemployed, part-timers who need full time and all of the people not counted who report they want a job:
18.09%
If one takes those 28,902,000 and simply divides by the non-institutional population, the unemployment rate becomes 12.06% Now this number is invalid for obviously there are many people in this country who don't need a job, aren't looking for work for many reasons, a top one being retirement. The group not in the labor force means just that, so this calculation is inaccurate. There are 86,443,000 people not in the labor force who are part of the non-institutional civilian population.
What happens to the unemployment rate if we just add in these people who want a job, but aren't counted, as reported by the CPS, and don't count those who have part-time work? Then, the unemployment rate becomes 12.83%.
On all above ratios the denominator, civilian labor force did have added to it the amount of people being added who officially are not considered part of the civilian labor force.
ShadowStats claims the real unemployment rate is 22.7%. ShadowStats takes U-6 and estimates an additional tally of discouraged workers past the 1 year time window which currently defines the discouraged worker group. He calls them long term discourages and the BLS definition, short term discouraged workers. Additionally shadow stats tries to use methods from before 1994.
The number of people not in the labor force who want a job, reported by the BLS, is an actual survey question. Every month survey takers interview 60,000 people, so one would assume the results from this survey question would more accurately reflect longer term discouraged workers.
Bottom line, the situation is bleak, but hopefully this exercise for the reader explains a little bit more on where these unemployment statistics one hears quoted are coming from and what they assume.
"Additionally shadow stats
"Additionally shadow stats tries to use methods from before 1994."
It seems you object to this. Why?
why I object to shadow stats
Because I cannot find his exact methods. If he's going to challenge the government and act like this is all one big conspiracy theory plot, then he needs to publish, for free, exactly what his methods and assumptions are.
Same is true for ADP. When dealing with large numbers, and IMHO, too small sample sizes, plus we have the never ending refusal to categorize illegal immigrants and guest workers, which in this day and age, due to corporate desired globalized cheap labor supply, one needs statistics on...
assumptions, super sets, subsets plus a civilian non-institutional population that is still derived from a baseline Census of now 11 years ago...
One needs to see exactly what the definitions are, the assumptions, how statistics are derived, their error rate, and so on.
Obviously we've got some serious issues going on here when one can double the unemployment rate by adding in forced part time and those not counted as part of the labor force who report they want a job.
What's the real count? At this point, it seems all one can really say is valid is the rate of change and even that needs to be done really over a 3 month time window.
Yes, we compare on a month to month, but you even get huge yearly revisions now....
Then, between December and January they do a once yearly population adjustment, but not spread out, tacked onto that differential. What a gotcha and many a financial, economic journalist has written complete fiction as a result on that one.
Just like with PCE and GDP and so we could really use a revamp of data collection methods for our statistical government branches.
So, bottom line, there is huge variance and one should publish, make public all assumptions and methods.
You can't just pull some number out of your ass and claim it to be the number, for clearly depending on how one categorizes, assumes and even takes the raw data collection, you can get many different numbers here.
Alternate Unemployment Rate!
I just came upon this post with your discussion of alternate unemployment rates, and I am so happy that you are discussing one of the same alternate unemployment rate calculations that I have also been using. I came up with 18.08% vs. your 18.09% for July. I'm certainly not going to quibble about one hundredth of a percent.
And I'm also glad that you are questioning Shadow Stat's alternate calculation for basically the same reasons that I am. It seems to me that one can't count people as unemployed unless they are answering the "want a job" question in the positive.
Anyway, I started really digging into unemployment numbers about a year ago because I knew that so much that people were saying about unemployment was just plain wrong.. and there was so much misinformation out there.
Thanks for your careful work! I bookmarked this site a while back, but I hadn't seen this post until today.
you might get an account
We try to calculate from first principles here, actually read the gov. stats and interpret. I see you're doing that as well and getting some focus on the horrific numbers is good.
Available LF is elastic: Full Employment
First, I wish I could vote for the article by Oak more than just one time! Truly excellent!
But about elasticity:
Remember back in the Clinton years when it was noted that people came out of retirement, disability, student or other non-employed status to take jobs? It was quite a surprise to some economists who expected greater upward pressure on wages. Even without the deviltry of legal, quasi-legal and illegal immigration, the number of persons available to take jobs when conditions approach real full employment -- is elastic.
Having said that, I like the 18% number, assuming that survey methodology is solid down to the details. But I can only gauge it against the feel I get in local conditions. It's really one of those averages of averages of averages, when we analyze the national survey down to the fundamentals. Of course, the Oak number is TWICE the official government number, which itself is contested by FAUX and our GOP neighbors because they think all unemployment is a scam until there is no sign anywhere saying "Job Applications Accepted".
I presume that there is nothing wrong with ShadowStats "trying to use methods from before 1994" -- except that when results are compared to results based on methods currently in use, the different bases should be noted.
Current Method
Is the survey truly of a random sample and of what population (how is the population defined operationally)? Is it door-to-door like the Census? Or is it a phone survey?
Almost all surveys these days are phone surveys, but many people and households today have only cell phones and how do we know how many cell phones or phone numbers to a residence, to a family or to a person? If we do know that, how do we adjust our survey for what we think we know. If the calls are based on residential phones, many working or looking-for-work people today (even not limiting this to illegal immigrants) either do not have landline service or are living in non-residential situations that are not necessarily legal (per code enforcement or other law enforcement or per rental agreements).
You can get very different results sometimes just by rephrasing a question asked in a phone survey. What exactly was the wording of the sample question? What questions preceded the survey conversation? Are various wordings tried in each survey and results compared for bias? Was there a follow-up going door to door to audit a sample of the sample? To what extent were individuals counted as employed (or unemployed) actually reported on the basis of information from the person answering the phone call but not the individuals themselves? To what extent, on average, were such reports biased and in what direction?
In 2011, as I understand it, a major problem is that people become homeless and therefor difficult to track. Another problem is the underground economy.
Of course, the entire survey process as well as how the survey data is analyzed -- that's all subject to political influence. Political pressure has been applied through bureaucracies to aggressively move people off UI or other government programs (or not). Such a variable is tricky or impossible to include in any econometric model.
Methods before 1994
In the 70s and 80s, there were index card files worked at the Department of Employment ('Human Resources', 'Economic Development', etc.). The card files were based on people coming in and registering in the section that was operated like an employment agency. The section that took and managed UI claims was separate, but to apply for UI, you had to register in the job-hunting section. Similarly, I believe, (when Food Stamps came into existence) to apply for Food Stamps, you had to register as looking for work and undergo other tests proving availability for work (unless unable to work by reason of disability).
The index card files (this is before ubiquity of personal computers) were worked by employees of the Department of Employment who would make phone calls or send out postcards to see if there really was someone there looking for work (or if there were responses).
Of course, one problem was that most people did not consider the Department of Employment to be a great resource for job hunting and found other ways to look for work, ignoring the Department of Employment job-hunting section unless they were receiving UI. (Of course, if you were in a union hall, you could ignore the Department of Employment job-hunting section, unless maybe that isn't true when you go on UI extensions.) Also, people would not return calls or they moved away or whatever and, unless they were receiving UI, they could easily fall through the cracks.
An Unused 'Survey' Method that Should Be In Use
We need a measure of participation in work programs offered (except that there probably now are no such programs generally or even for targeted groups). The statistical methods could even be sophisticated like those used in mark-and-release wildlife programs. (An early benefit of all this would be some employment for statisticians!)
I think that, in times like this, one measure that should be applied is participation rates in governmental (or non-governmental) work programs. Identify the work and advertise it's availability. It has to be real enough that it includes unemployment insurance and social security. Also, it has to be real enough that at least some of the slackers can be laid off for cause or for failing to show up. Anyway, from that governmental program, just keep it up until you no longer have any takers, or the number of takers is very few and can be dealt with individually. That's called 'full employment'. Of course, a requirement of such a program would have to be that only people legally in the U.S. and not receiving disability income could apply.
There used to be, and maybe still is, a local non-governmental program in Billings, MT, called "Billings Monday." On every Monday, the businesses of Billings would guarantee one day of work for every person who showed up -- not including drunks and not including illegal immigrants (not confusing those two populations!).
I am not saying that such programs would or should become the be-all and end-all of unemployment number-gathering, just that some such programs should be included if we are pursuing a full employment policy. Such programs can be tried experimentally in 'selected markets'. Of course, we know from observation of LBJ's 'war on poverty' that we have to audit and watch out for such phenomena as 'phantom workers', in some geographical areas more than others.
Whatever happened to Full Employment?
Anyone remember the Full Employment Act of 1946? No, I dont suppose ... even though I think it's still in Title 15 (USC) somewhere.
Of course, our government today -- almost all political leaders and the corporate mass media -- are not pursuing or considering a full employment policy. They aren't even considering using the term 'full employment'. The very concept of full employment has been lost from view in the U.S.A. today.
Even here at EP, people sometimes ask what's wrong with the Democratic Party today? The answer to that question, we could start with that most Democrats fail to talk about or target a full-employment policy for the country. They much prefer to talk about unemployment in this, that or the other demographic -- anything but a comprehensive full employment program! (Anything but discussing systemic problems and possible solutions!)
How would a full employment program be paid for? Y'all know my answer to that: 15% Across-the-Board Tariff! I know, I know, price of imported oil would go up and we would all be screwed, beyond what we are already being screwed already. So, how about this: big cuts in military spending?
survey methodology
First it's an in person visit and then people mail back questionaires.
You can read all of the details here, CPS survey methodology.
Thanks
I've been reading it over. Especially the 2002 PDF. Not based on phone numbers, it's based on residential units, although of course more than 90% of the survey in most of the follow-up months (on average) is done by phone after initial visit. Nothing wrong with that.
Probably difficult to keep up with people moving as a result of foreclosures and all, also there are people (citizens) living in officially non-residential living units as well as people squatting, and then there are the outright homeless camping out, including families with children, but what can a survey do? The methodology has to be consistent from year to year.
Increasing social instability, including illegal immigration, presents substantial problems for the Census too, but I know that they try very hard to count everyone (including illegals).
It's state-based (with two extra states for LA and NYC).
I think it's as solid as it gets.
The 18% number looks very good as the current reality-based statistic that most people are probably looking for. There's certainly almost no upward pressure on wages.
Excellent research and analysis by Robert Oak, as usual.