
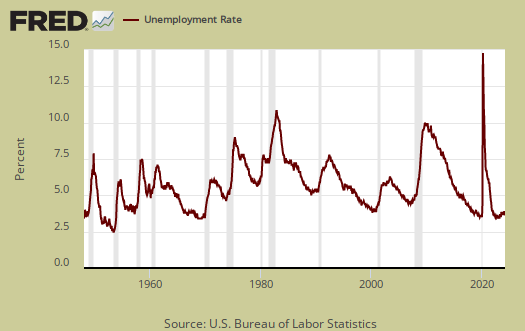
The August unemployment report shows steady as she goes sorts of statistics. Yet, the report is really a mixed bag. The unemployment rate dropped two tenths of a percentage point to be 5.1%. The labor participation rate remained the same, 62.6%, and hasn't changed for three months. Once again over a quarter of a million people dropped out of the labor force. The ranks of the unemployed dropped almost as much and those employed grew by almost two hundred thousand. Generally speaking one month of employment statistics isn't enough to base any conclusions on, but the labor participation rate has remained at it's October 1977 low for three months now. Once again the very low unemployment rate makes the picture look much better than the situation really is.
This article overviews and graphs the statistics from the Employment report Household Survey also known as CPS, or current population survey. The CPS survey tells us about people employed, not employed, looking for work and not counted at all. The household survey has large swings on a monthly basis as well as a large margin of sampling error. This part of the employment report is not about actual jobs gained.
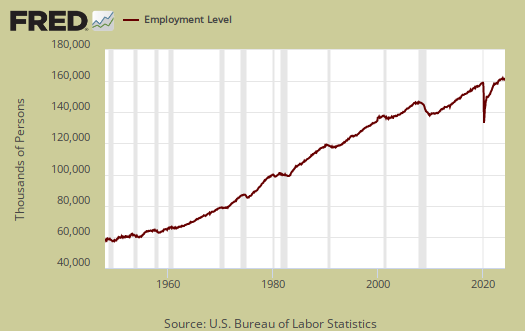
Those employed bumped up by 196,000 this month. From a year ago, the ranks of the employed has increased by 2.585 million. That's more than enough required to keep up with population growth.
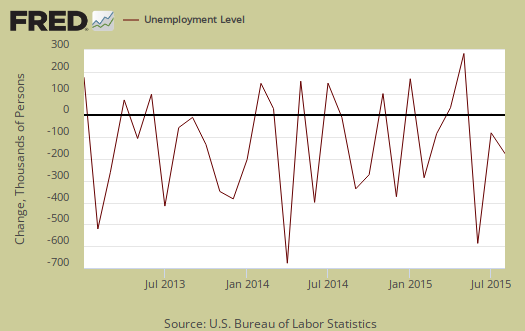
Those unemployed decreased by -237,000 to stand at 8,029,000. From a year ago the unemployed has decreased by -1.539 million. Below is the month change in unemployed and as we can see, this number typically has wild swings from month to month.
Those not in the labor force increased by 261,000 to over ninety-four million. The below graph is the monthly change of the not in the labor force ranks. Those not in the labor force has increased by 1,821,000 in the past year.

The labor participation rate stayed at 62.6%, which is no change from last month and a low not seen since October 1977. Wow.
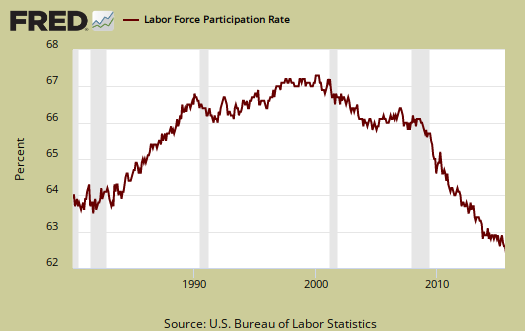
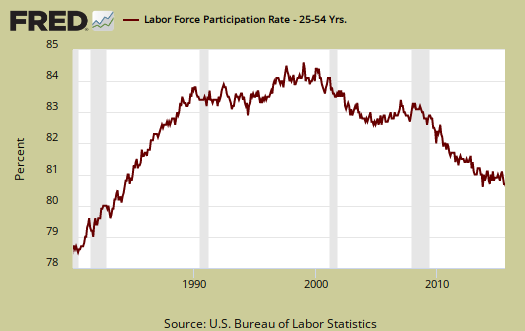
Below is a graph of the labor participation rate for those between the ages of 25 to 54. The rate is 80.7%, which is no change from last month and a rate not seen since September 1984, (discounting times past the great recession when the American work experience collapsed). This proves labor participation rate cannot be explained away by retiring baby boomers and continuing education past high school full time as these are prime working years for people.
The civilian labor force, which consists of the employed and the officially unemployed, declined by -41 thousand this month. This implies even more people dropped out of the labor force for the month since the labor force consists of those employed or officially unemployment. The civilian labor force has grown by 1,047,000 over the past year. New workers enter the labor force every day from increased population inside the United States and immigration, both legal and illegal. The small annual figure also implies people are dropping out of the labor force. Notice how those not in the labor force has grown 174% bigger than the civilian labor force.

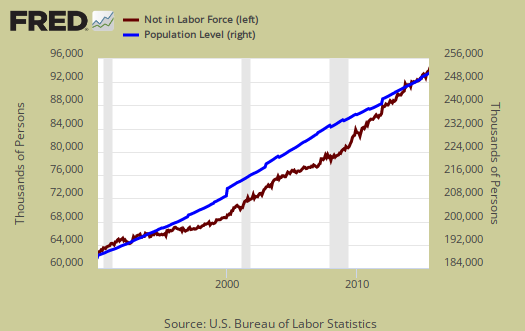
In spite of wild statistical swings, those not in the labor force often grows faster than the population which has the potential to work. Below is a graph of those not in the labor force, (maroon, scale on the left), against the noninstitutional civilian population (blue, scale on the right). Notice how those not in the labor force crosses the noninstitutional civilian population in growth and the accelerated growth started happening right in 2008. The increase cannot be explained by retiring baby boomers alone and frankly if the economy was really booming, just would not be continually increasing by this magnitude.
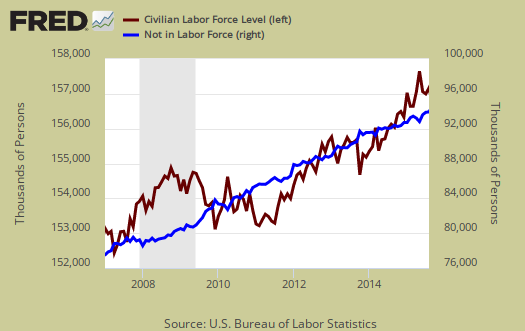
Below is a graph of the civilian labor force, or the official employed plus unemployed, in maroon, scale on left, against those not in the labor force, in blue, scale on right. Notice how those not in the labor force as a trend exceeded those considered employed and unemployed starting around mid 2009. Starting in 2014 it has reverted back. The never ending growing segment of the population that is considered neither employed or unemployed, was above the trend line of those who would be naturally dropping out, such as the retired and those in school. This shows those not in the labor force was growing much faster than those obtaining jobs and being counted as looking for work. Not in the labor force figures do include retirees and the size of the population greater than age 65 has grown.
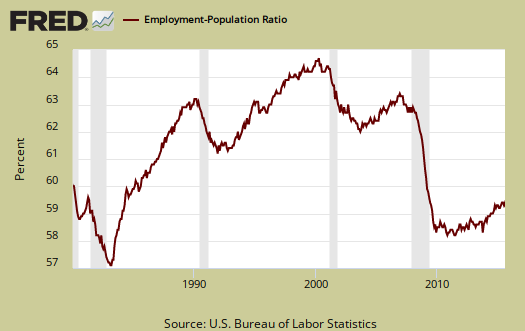
Those considered employed as a ratio to the total Civilian noninstitutional population now stands at 59.4%, a 0.1 percentage point uptick from last month. The relationship between the employment-population ratio and the labor participation rate (LPR) is: employment-population ratio = LPR * (1 - unemployment rate).
A more disturbing figure is how those forced into part-time work due to the economy increased by 158 thousand for the month. Those forced into part time work for economic reasons stands at 6,483,000 people. There are still millions of people who need full-time jobs with benefits who simply can't get them. The annual decrease of -740 thousand. This really isn't a lot considering the supposed better economy.

There are two categories of those forced into part-time jobs due to economic circumstances. Those who could only get part-time jobs and those already working who got their hours cut due to businesses not having enough work for them. The number of people who could only get part-time work increased by 29,000 as shown below.

People can also work part-time hours due to slack business demand. People who got their hours cut due to slack working conditions inecreased by 13,000 and stands at 3,841,000. Below is a graph of forced into part-time work because they got their hours cut, as a percentage of the total employed. This is a recession economic indicator and this figure just is too elevated still for this supposed robust economy operating at full-throttle.

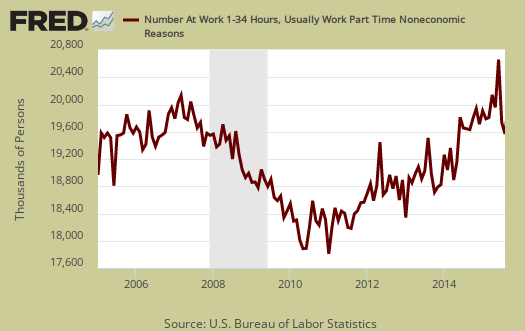
Part-time workers who are voluntarily working part-time jobs dropped by -131,000 to stand at 19,760,000.
U-6 now stands at 10.3% a -0.1 percentage point decrease. U-6 is a broader measure of unemployment and includes the official unemployed, people working part-time hours because that's all they can get and a subgroup not counted in the labor force but are available for work and looked in the last 12 months. The U-6 rate still leaves out some people wanting a job who are not considered part of the labor force, so while it is called an alternative rate, but it still ignores those long term hopeless and desperate. This drop is due to the official unemployment rate dropping, again because people dropped out of the labor force.

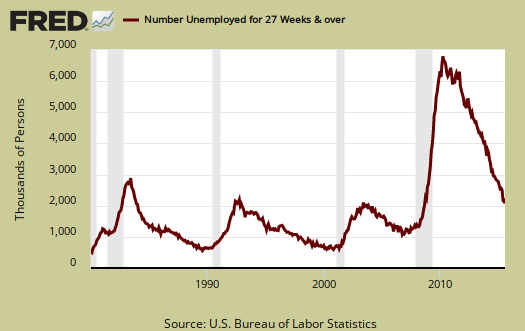
The long term unemployed, or those unemployed for 27 weeks and over, did increase slightly by seven thousand to 2,187,000 people. From a year ago the long term unemployed ranks has declined 26.3%. This decline without a corresponding bump up in employed also implies many long term unemployed are simply dropped from the labor force.
Within the CPS survey is how many people who are considered not in the labor force who report they want a job now. It is a direct survey question. The Census asks people who are not being counted in the unemployment statistics and official unemployment rate if they want a job. The number who answer yes currently stands at 5,932,000, a very large number of people by did decrease by -203,000 from last month. Those who are not counted yet report they want a job includes the discouraged workers and marginally attached and is seasonally adjusted. This figure has decreased -6.3% from a year ago.

The average length of unemployment is 28.4 weeks and a year ago was 31.9 weeks. This is a 3.5 week drop from a year ago The average time to be unemployed is still completely out of line with the median due to the long term unemployed. As the long term unemployed drop out of the labor force, this figure artificially drops.

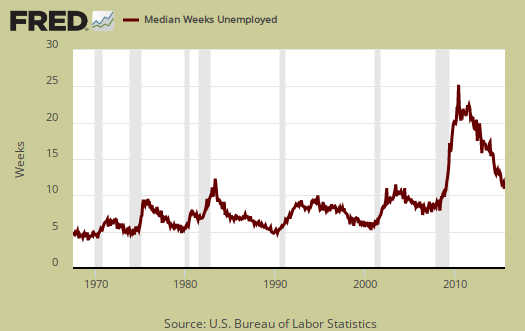
The median time one is unemployed, which means 50% of people have gotten a job in this amount of time is 12.1 weeks and increased 0.8 weeks last month. A year ago the median time to be unemployed was 13.3 weeks.
This month's CPS report warns. To focus on just the plunging official unemployment rate is a huge mistake. Underneath the numbers shows a disturbing trend of people just dropping out of the count. The never ending low labor participation rates are just not changing and simply cannot be explained by baby boomers retiring. Here are our past overviews CPS unemployment statistics, only graphs revised.
labor force participation rate fractionally lower record...
the labor force participation rate fell from 62.623% in July to 62.552% in August, a new 38 year low, albeit officially statistically unchanged at 62.6%..
rjs
number crunch
I need to go calculate all of the LPR's, this is astounding and cannot possibly be just baby boomers.
not just baby boomers
Bill McBride has a new post up showing the prime aged work force (24-54) is growing again...and that group is still lagging in labor force participation...
rjs
First. it should be clearly
First. it should be clearly understood that Unemployment" is a relatively meaningless metric since the "Civilian Labor Force" has now fallen to below 50% of the entire US population. The association between GDP growth and "Compensation of Employees" is clearly far more relevant than the touted associations of economic growth with monetary easing, employment headcounts, or all the rest of the rot bandied about.
There's more of course. The above and several other FRED charts -- far better reflecting the ability of our economic policy makers (and legislators) to keep our nation's citizenry productively employed, are shown on http://www.bobmeijer.com/sitebuildercontent/IEM_D.htm
Benchmarks show seriously lower payroll numbers
The BLS has just released March 2015 benchmarks, preliminary. OMG, -208,000 total and -255,000 total private for just the month of March as a revision.