
A few weeks ago I diaried that, while Housing is nowhere near bottoming, nevertheless there was substantial evidence that the decline may be shifting from the vertical, "guillotine" phase to the more bumpy "sandpaper" phase. I wrote:
In the case of the housing market crash, how would the change from "guillotine" to "sandpaper" look? In the past, Calculated Risk has reckoned that the inflection point between advancing and declining house prices was at about 7 months' supply. So I submit that first of all, we would see a decline in months' supply of houses for sale towards that mark, as sales started to outstrip new house starts and existing homes being offered for sale. In order to accomplish that, you would first need to see that new home building has declined to a level where sales exceed new starts. You would also want to see existing home sales increasing on a year-over-year basis. In other words, the volume of new home starts would transition from guillotine to sandpaper first, well before prices themselves would begin the transition.
And Guess what? All of those conditions have either started or appear to be on the cusp of starting.
If one wants to hope that the housing crash at least in some respects might come near bottoming out next year, then this week's new and existing home sales data are cause for concern.
In the first place, new home sales continue to crash. In one sense, that might be a relief. You can either have a longer, more protracted decline, or a quick crash reaching bottom sooner. Cliff-diving, which is what new home sales are still doing, accomplishes that latter choice very well, thank you very much.
On top of that, as can be seen on Tim Iacono's graphs, months' supply of both new and existing homes has once again bumped up against its upper threshold. The idea that months' supply might be topping out and getting ready to decline is a necessary predicate to any lessening of the housing crash. This month's data doesn't negate that idea, but it certainly is consistent with yet another surge of home supply on the market.
Finally, and most ominously, unlike September and October, where existing home sales were equal to or higher than they were a year ago, in November existing home sales declined dramatically from a year ago, as shown on this graph courtesy of Calculated Risk:
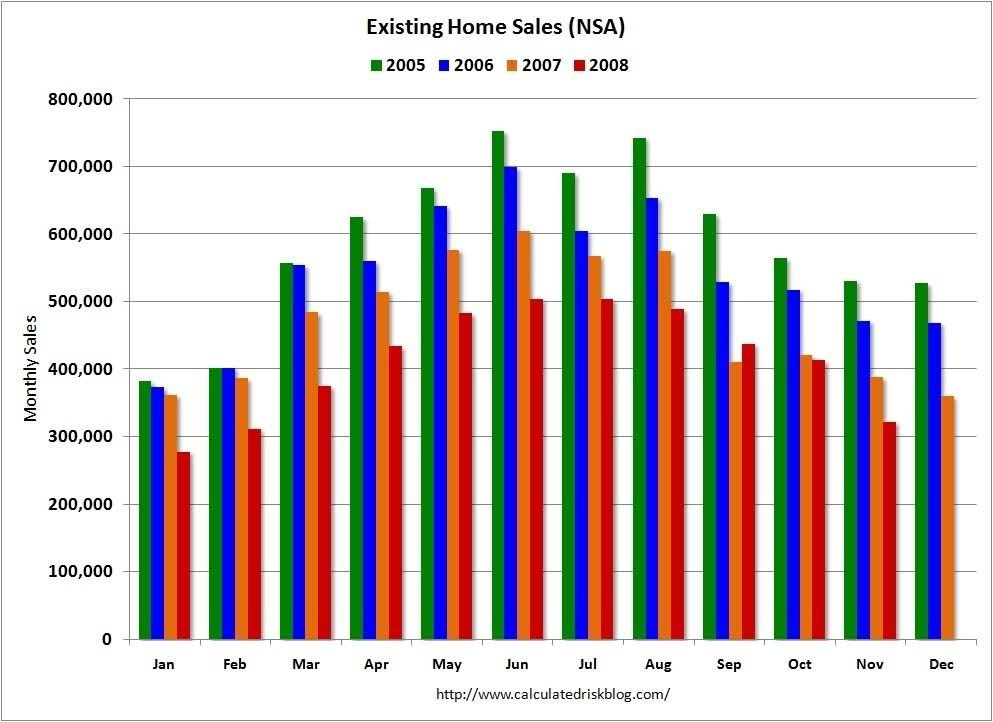
As CR notes, existing home sales for November are based on contracts signed in September and October. In other words, this is the first month of data showing the effect of Black September on consumer confidence as applied to buying houses. And the news is horrible. Existing home sales are down well over 10% again from a year ago. In other words, the autonomous consumer decline brought about by Black September appears to be causing a renewed, more intensified, slump in the housing market. This is not good news at all.
Recent comments