
There are some absolutely ridiculous articles on the July jobs report. Some are proclaiming the economic slowdown is over, which is absurd on it's face. One cannot conclude that from one month of payrolls data which will probably be revised. Just as absurd is this article trying to claim the July payrolls increase is made up, or this one, touting the alarmist headline of -1.2 million jobs lost for July by quoting the not seasonally adjusted July payroll establishment survey number. Seasonal adjustments and death/birth models are suspect, the topic of conspiracy and government political plots. Bottom line, survey methods are so antiquated they simply do not have the resolution and accuracy to go economically ballistic over the jobs report, either way, on a month to month basis.
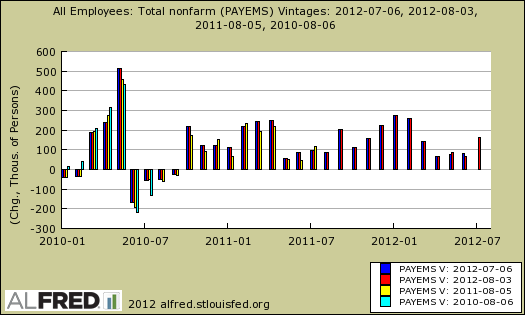
First, payrolls are often revised. Check out the below graph which shows various revisions on payrolls since 2010. You can see more often than not, the monthly change in payrolls is eventually revised.
The reported job growth has a 100,000 margin of error on a month to month basis. That means there is a 90% confidence level for any reported CES nonfarm payroll growth or contraction outside of that range. In other words, a monthly jobs report claims payrolls grew by 250,000, yup, we had job growth. A monthly BLS employment report which shows payrolls grew by 34,000, oops, we're in the margin of error, we don't know if jobs grew by 134,000 or instead we lost -66,000 jobs.
This is our problem. The United States has been creating so few jobs, each month we're literally rolling around in the margin of error most months. Bottom line, one cannot freak out over a difference of 20,000 payroll jobs. Officially, one needs to remember, we have a margin of error in monthly payrolls that often exceeds the reported monthly job growth. The monthly margin of error is much higher for the CPS survey, 400,000.
One thing noted in the July employment report were less layoffs in durable goods. Right there is a statistical distortion for this year in manufacturing jobs.
Within durable goods, the motor vehicles and parts industry had fewer seasonal layoffs than is typical for July, contributing to a seasonally adjusted employment increase of 13,000.
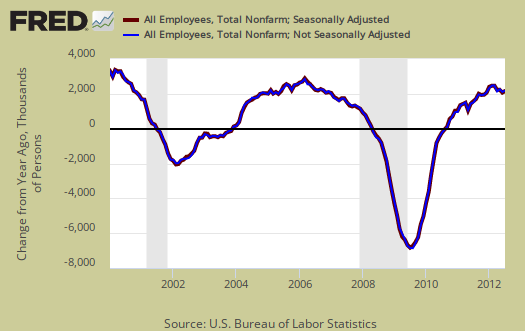
Second, below is the graph of CES seasonally adjusted payrolls change from one year ago against the not seasonally adjusted payrolls. Because this graph represents a solid year of job growth (or loss), the two values should be the same, since seasonally is wiped out due to the time period. We can see some variation, but for the most part the two graphs match.
Seasonal adjustments are from a complex modeling algorithm called X-12 ARIMA, which is a glorified moving average, but also uses statistical methods which rely on past trends. This isn't some alchemy, it's actually statistics and standard methods to smooth curves and remove seasonality. The BLS and other government agencies use seasonal adjustments so one can see what is real job growth vs. what is just the weather. Without seasonal adjustments, we don't know if December had a record number of Santa Claus hires or if there was actually real permanent job growth happening during Christmas.
Folks, employment in this country is highly seasonal. Think about summer jobs, teachers off for the summer, Christmas hiring, our favorite end of the year layoffs. There is a host of stuff that happens seasonally. Life guards are hired, manufacturing plants shut down to retool, crop harvest happens and the list of seasonal employment goes on and on. Educational alone drops 20% for the summer. School's out and so are jobs.
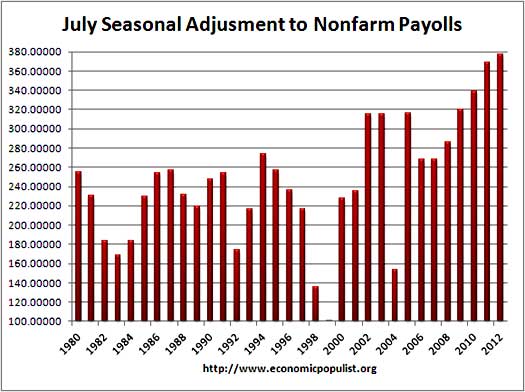
Below is the July month only, going back to 1980 of seasonal adjustment amounts. While the graph shows this July has been the largest seasonal adjustment going back over 30 years, that still doesn't imply conspiracy. What it can imply is we have way less jobs, seasonally, in summer than in previous years. Considering the implosion of the housing market and construction, both highly seasonal, this indeed might be the case.
The CES survey is actually fairly complex, with a host of weightings and statistical estimates used. Don't like this? Demand all employers report payrolls monthly and talk to Congress. Yes folks, data methods for our government are from the 1960's with politics and even corporations refusing to give worker data and requiring our government to sign non-disclosure agreements for some of the statistics, if they give them at all. We need better raw data, bottom line, more real time and more data points, including immigration status of workers. Write your Congress people, they control the purse strings, but don't blame the BLS working within the limits of what they got.
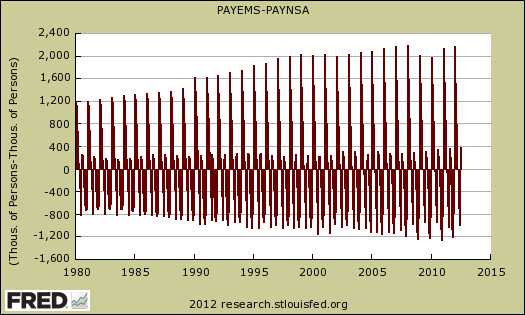
The below graph is the actual seasonal adjustments all year and as we can see they are large, which causes folk unaware of the seasonality of employment to freak out. Bottom line to really get a feel for seasonal adjustments, one must understand the X-12 ARIMA algorithm itself, plus analyze a host of seasonal inputs and then run some correlation and auto-regression algorithms to try to ascertain if there is an anomaly of recent. Guess what, to figure that out, you need historical data and that is why one cannot second guess this algorithm in real time, ya gotta go back and run the numbers once the data comes in and that is called lag and why we have in part, benchmark adjustments.
Bottom line folks, seasonal adjustments are not some grand conspiracy, but they do require adjustments and most importantly, historical data. It ain't real time and this isn't some grand conspiracy by our government, it's the limitations of accurate seasonal predictive modeling, sample size and data time lag.
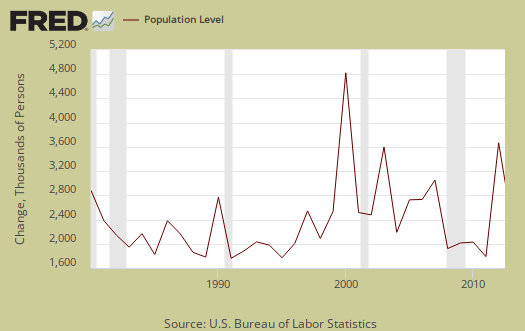
For those wanting to blame the large July seasonal adjustment on population, think again. The adjustment cannot be an increase overall in the population causing the increased variance in seasonal adjustments. Below is the annual change in civilian non-institutional population and as we can see, the growth is much less.
The birth/death model is also something which generates volumes of extreme paranoia. What the birth/death model does is estimate payrolls for newly started businesses not part of the survey and ones that go under in a short time window. This is done because of data lag. In other words, these business startups and failures happen so fast, they are not part of the official survey, so they are estimated, using another statistical algorithm. Business start and fail every day and these startups and failures are also seasonal. This month the CES birth/death model added 52,000 additional payroll jobs. But, that is to the not seasonally adjusted payrolls, which shows a monthly change of -1.204 million! In other words, the birth/death model added a drop in the statistical bucket overall for July 2012.
From April 2011 to March 2011, a year, the birth/death model gives an increase of 491,000 payroll jobs. Is this possible? Can we really just pull half a million jobs out of thin air and claim they are from new businesses? Yes, if that many new businesses actually started. Many new businesses hire extensively. A new restaurant has to hire cooks, wait staff, dishwashers and so on. A new store needs counter help most likely. On the other hand, if more businesses failed than started, that's a problem and could skew the overall yearly amounts. This is again why we have actual real data, called benchmarks, to see if the model worked and to correct previous estimates. The birth/death model is adjusted by benchmarks on a yearly basis.
Bottom line, this is why one should not get attached to government statistics, especially when they are first released, the revisions will happen, extensive revisions. It also shows how in 2012 we need larger sample sizes, more real time data, more data points and more statistics collected and reported.
This issue comes up every month. See our last article when people tried to blame the lack of jobs on the weather. You want better statistics? Demand Congress improve raw data collection.
Recent comments