
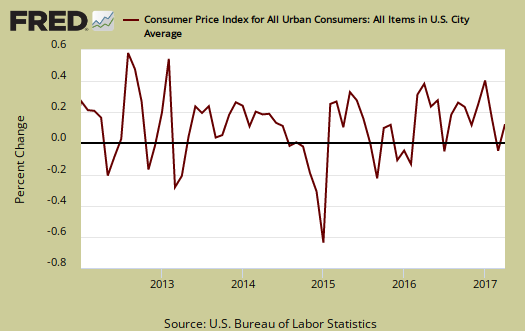
The Consumer Price Index for April reversed last month's course and rose by 0.2%. Inflation increases were across the board. Food rose 0.2%, energy 1.1% and all other items together increased 0.1%. Shelter continues on it's tear with a 0.3% monthly increase. Natural gas had a huge monthly increase of 2.2%. Fresh vegetables had the largest monthly jump since February 2011, an increase of 5.1%.
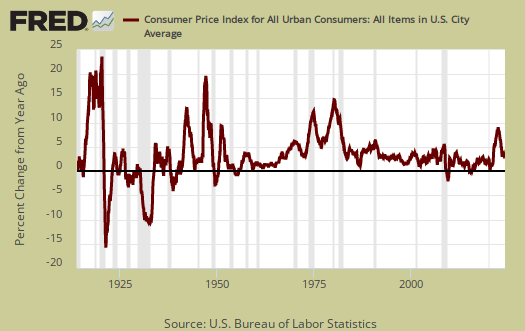
Yearly overall inflation was 2.2% and is shown in the below graph. This is less than March's 2.4% annual inflation rise but the average prices increase over the last 10 years has been much lower, 1.7%.
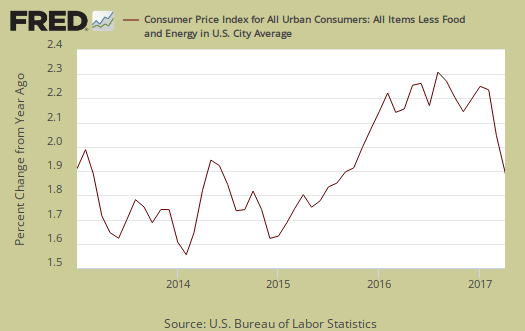
Core inflation, or CPI with all food and energy items removed from the index, has increased 1.9% for the last year. and this is the same as last month. Core inflation is the figure the Federal Reserve considers for interest rate increase decisions. For the past decade annual core inflation has risen an average of 1.8%.
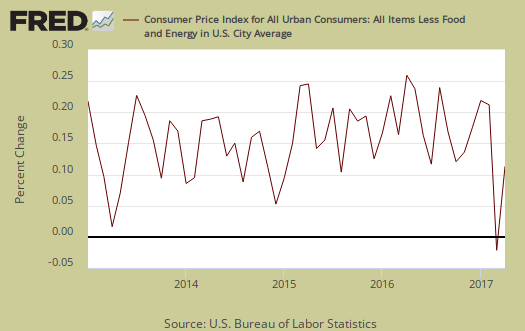
Core CPI's monthly 0.1% percentage change is graphed below. Within core inflation, shelter increased 0.3%. Rent increased 0.3%, whereas hotels and motels increased 2.4% after last month's revised -2.8% decline and home ownership equivalent rent increased 0.2%. Shelter overall is up 3.5% for the year with rent increasing 3.8% annually. Wireless service dropped another -1.7% after last month's whooping -7.0%. Tobacco had it's biggest increase since 2009, 4.2%. That is most likely new taxes and as people quit or don't start, that tax revenue is thinning.
The energy index increased 1.1% for the month and is up 9.3% from a year ago. The BLS separates out all energy costs and puts them together into one index. Fuel oil is up 22.1% for the year, while dropped by -0.3% this month. Natural gas rose by a significant 2.2% but is up 12.0% for the year. Electricity went up 0.6% for the month and has increased 2.4% for the year. Graphed below is the overall CPI energy index.

Graphed below is the CPI gasoline index annual percentage change and for the month gas increased by 1.2%. For the year, gasoline has now increased 14.3%.

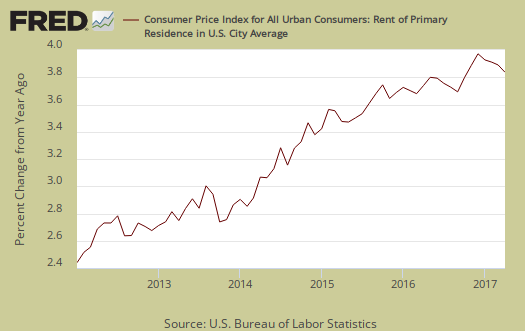
Graphed below is the rent price index which has been soaring for some time, now up 3.8% annually, and is shown in the below graph.
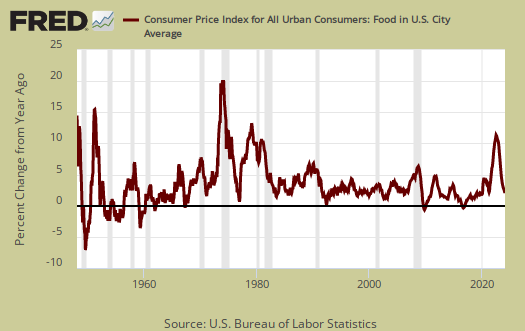
Food prices increased by 0.3% for the month. Food and beverages have now changed 0.5% from a year ago. Groceries, (called food at home by the BLS), increased 0.2% for the month but are still down -0.8% for the year. Fresh fruit jumped 2.2% for the month and fresh vegetables by themselves soared 5.1%. One can probably blame the never ending rains hitting the West coast as the reason for the price increases as the mud and run off won't let crops be planted or harvested. Dairy and related products increased by 0.3% for the month. Eating out, or food away from home increased 0.2% for the month and is up 2.3% for the year.
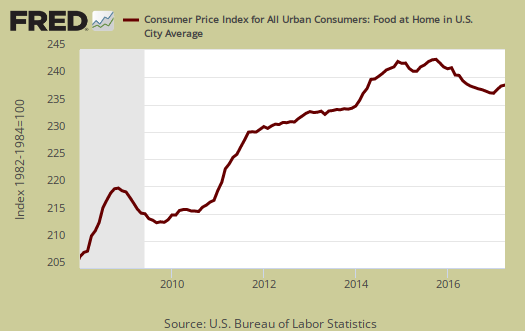
Graphed below are grocery prices, also referred to as the food at home index. Inflation figures are fairly misleading for substitution is allowed in figuring price increases. In other words, if steak is too expensive the BLS considers hamburger the same in terms of inflation. Also, horrific chemical and toxic junk is mixed in with healthy foods when computing inflation.
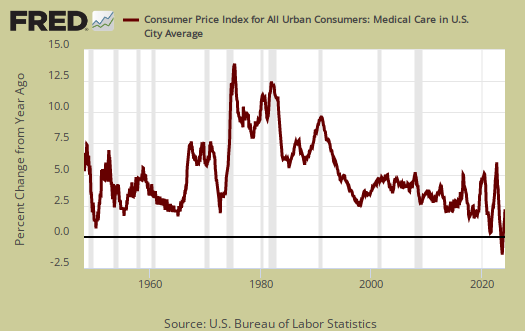
The Medical care index, part of core inflation, decline a rare -0.2% for the month. Prescription drugs dropped almost a percentage point, -0.9% for the month, but hospital services increased by more than that, 1.0%. Physicians services dropped by -1.2% for the month. Graphed below is the overall medical care index, which is up 3.0% from a year ago.
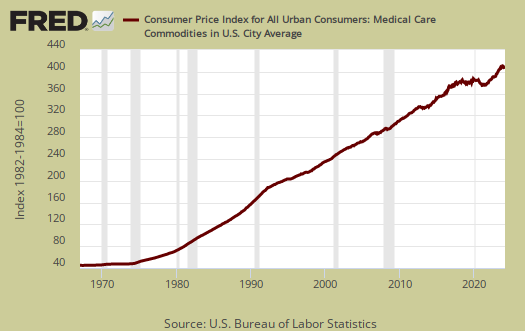
Below is a graph of the medical commodities index, which is mostly prescription drug prices and is down by -0.8% for the month, up 2.6% for the year.
Real hourly earnings increased by 0.1% for all employees. Real means wages adjusted for inflation. CPI rose by 0.2% while hourly wages increased by 0.3%. For the year real hourly earnings have increased 0.4%. The average real hourly wage is now $10.73 and the average wage, not adjusted for inflation is $26.19. Weekly real earnings increased by 0.4% as hours worked increased 0.3%. For the year real weekly earnings have increased 0.3%. Real weekly earnings now stand at $369.00. The work week is 34.4 hours. There is a separate category for production and nonsupervisory employees, which means worker bees and their real hourly earnings had no change for the month to $9.22 and their real weekly earnings increased 0.3% to $310.86. Their weekly hours increased by -03% to 33.7 hours. For the year production and nonsupervisory employees hourly earnings have had increased 0.1% and weekly earnings are up 0.5%. The BLS is crafty in defining who exactly are these worker bees, but it is obvious that the elites skew the data on wages and one should probably be looking at the production and nonsupervisory data to see what is going on for most people working.
CPI details
The DOL/BLS does take yearly surveys on where the money goes in the monthly budget, but as one can see, food and energy are significant amounts of the monthly finances. Run away costs in these two areas can break the bank, so can food. Additionally CPI uses substitution, so if flour goes through the roof, somehow we're all just fine with oats and prices didn't really overall increase much. Here is the BLS CPI site, where one can find much more details, information on calculation methods and error margins.
Other CPI report overviews, unrevised, although most graphs are updated, are here. If you're wondering why the graphs display different figures from the text, the graphs calculate percentages from the index and do not round. The actual data from the BLS report does round to one decimal place. In other words, 0.05% is rounded to 0.1%.
Recent comments