
The Consumer Price Index for March 2011 increased 0.5% from last month. For the year, the Consumer Price Index for all Urban Consumers (CPI-U) has risen 2.7%, the highest since December 2009. The February CPI monthly increase was also 0.5%.
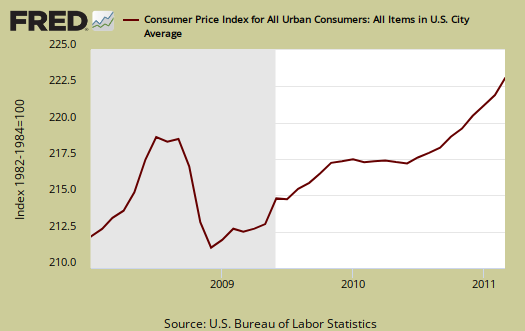
Gas and food was 75% of the CPI increase for the month. Food at home increased, 1.1% from February to March, Gas alone rose 5.6% and Fuel Oil increased 6.2% from last month. For the year, Gas is up 27.5%, fuel oil up 34%, that's over a third, and food at home has increased 3.6%. One must wonder what kind of substitution is going on with food though for it to only be 3.6% versus what real people experience at the grocery. Heating your house with gas, on the other hand, dropped another -1.4% and is down -5.5% for the year. Below is the monthly percentage change in CPI-U.

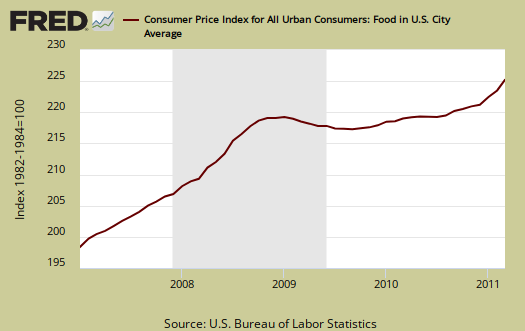
For the year we have a an 15.5% increase in the energy index and a 2.9% food index increase. The graph below is food, which includes food at home and restaurants.
Below are gas prices, last updated February 14th. Notice the oil bubble in early 2008. Fuel oils have increased 73.2% at an annual rate for the last three months. Did we mention that sudden spikes in oil are highly correlated with recessions? If one goes for the last 6 months, the fuel oils increase has been 65.4%.
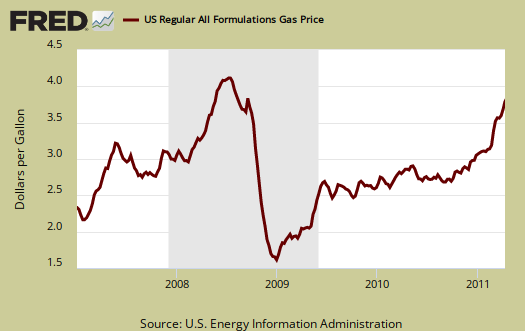
The CPI energy index, below, is all energy, gas, natural gas, fuel oil and so on. Notice it's dip and return versus the food index as well as how it's not as high, but clearly on the path, as the CPI energy index was during the oil commodities bubble of 2008.

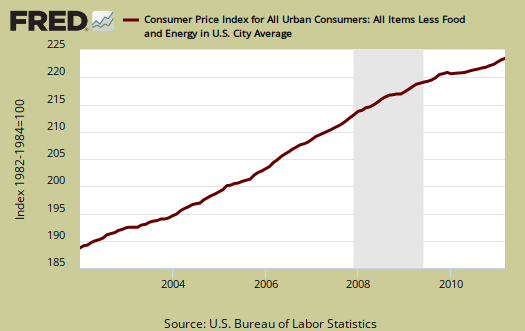
Core CPI, or all items less food and energy, also increased, 0.1%, whereas the last two month have seen core CPI increase 0.2%. For the year, core CPI, or minus food and energy, is off it's record lows, now at 1.2%.
Core CPI's percentage change is graphed below. As we can see, overall, without energy and food, inflation is pretty tame. That said, core CPI includes housing, shelter, which rose 0.1% this month and is only 0.9% of an increase for the year. Medical costs, as usual, have increased 2.7%.

Below is the St. Louis FRED graph to show the overall rate of change on core CPI, or CPI without food and energy included. Notice how the line is returning to it's rate of change, or slope, after the deceleration in 2008.
There has been much criticism as of late that the Federal Reserve only focuses in on core CPI, instead of food and energy. According to the BLS, Food and beverages, which includes food at home, makes up 14.8% of the index. Housing is 41.5% and transportation, including gas for the car, is 17.3%. Medical care is only 6.6%. All items minus food and energy are considered 77.2% of the total price expenditures for consumers.....according to them.
The DOL/BLS does take yearly surveys on where the money goes in the monthly budget, but as one can see, food and energy are significant amounts of the monthly finances. Run away costs in these two areas can break the bank. Considering we have price deflation in housing due to the real estate sector bubble pop, it's strange for food and energy consumer prices to be dismissed when crafting monetary policy.
Guess the concept of not having enough money for gas to get to the job interview ever occurred to them.
CPI-W for the month, unadjusted was 220.024, a 1.1% increase from last month and a 3.0% increase for the year. CPI-W is used to calculate government transfer payments, such as social security increases.
Note the the chained CPI-U also increased and this is adjusted for 2005 dollar values:
The Chained Consumer Price Index for All Urban Consumers (C-CPI-U) increased 2.5 percent over the last 12 months.
This report is from the BLS website. These numbers are for CPI-U, whereas the metric used to calculated social security and other government payments is CPI-W.
Last month's CPI report overview is here.
Recent comments