
The NAR reported existing home sales plunged -5.1% from last month and are down -5.1% from January of last year. This is the 3rd decline from from year ago. Existing home sales are now at July 2012 levels. While many blame the harsh winter on falling sales, in the West where weather has not been a factor, existing home sales declined -7.3% for the month and are down -13.7% for the year.
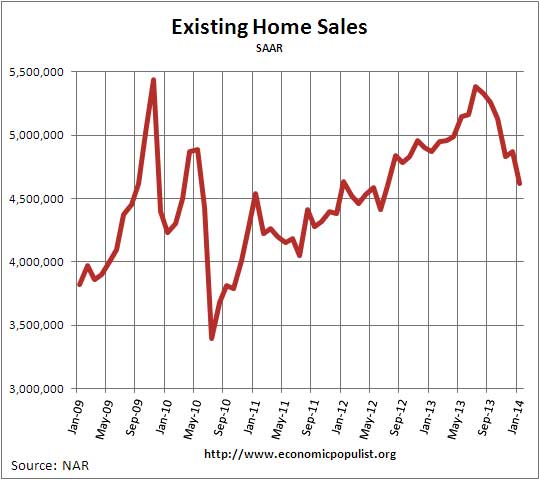
The above graph shows why existing home sales are showing declines from a year ago. At this point we are seeing a sort of mini-bubble for 2013. The NAR also mentioned problems with food insurance causing declining sales. Yet only 8 to 9 percent of sales needed flood insurance and of those, 30% of the transactions were cancelled. This equates to a little more than half of this month's sales decline is due to problems with soaring rates for food insurance. Below is a quote from the NAR on flood insurance and note these figures are not annualized.
Since going into effect on October 1, 2013, about 40,000 home sales were either delayed or canceled because of increases and confusion over significantly higher flood insurance rates. The volume could accelerate as the market picks up this spring.
The national median existing home sales price, all types, is $188,900, a 10.7% increase from a year ago. Below is a graph of the median price. One needs to compare prices only a year ago for increases due to the monthly ups and downs in prices associated with the seasons.
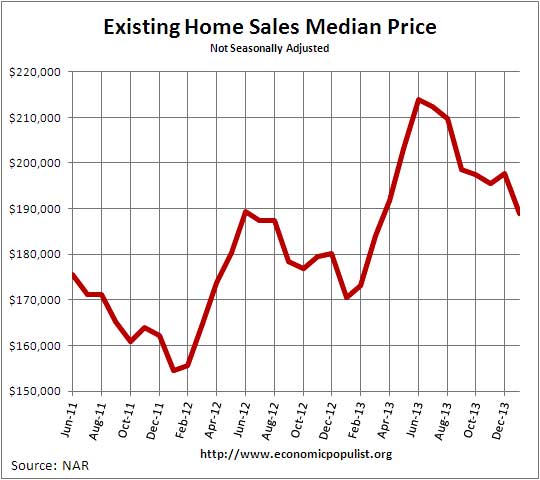
The average home price for January was $237,500, a 8.8% increase from a year ago. It appears that as bank owned properties and foreclosures dry up, prices are once again soaring and sales are down.
What is more interesting is the decline in distressed home sales. Foreclosures and short sales are now only 15% in January whereas a year ago they were 24% of all sales. The breakdown in distressed sales was 10% foreclosures and 4% short sales. The discount breakdown was 16% below market value for foreclosure sales and 13% for short sales.
So called investors are still buying up existing homes and they were 20% of all sales. All cash buyers were 33% of all sales with 70% of investors buying homes paying cash. First time home buyers were 26% of the sales. First time home buyers are at a record low, the lowest since October 2008 when NAR started tabulating how many existing home sales were to first time home buyers. NAR claims first time home buyers should be 40% of all existing home sales.
The median time for a home to be on the market was 67 days with a third of home sold within a month. Housing inventory remains very tight yet increased 6.5% from December. From a year ago unsold inventory has increased 1.4%. The current 1.9 million homes available is a 4.9 months supply.
RealtyTrac showed foreclosures increased 8% in January due to double jumps in foreclosure starts, yet are down 18% from a year ago. RealtyTrac also reports the median three bedroom house payment has increased 21% from a year ago.
Below is NAR's breakdown by existing home sales type and regions. Expect a temporary pop up in February on sales for in some regions of the country, the weather has been just crippling.
Single-family home sales fell 5.8 percent to a seasonally adjusted annual rate of 4.05 million in January from 4.30 million in December, and are 6.0 percent below the 4.31 million-unit pace in January 2013. The median existing single-family home price was $188,900 in January, up 10.4 percent from a year ago.
Existing condominium and co-op sales were unchanged at an annual rate of 570,000 units in January, and are 1.8 percent above a year ago. The median existing condo price was $188,700 in January, which is 13.0 percent above January 2013.
Regionally, existing-home sales in the Northeast declined 3.1 percent to an annual rate of 620,000 in January, and are also 3.1 percent below January 2013. The median price in the Northeast was $241,100, up 6.6 percent from a year ago.
Existing-home sales in the Midwest dropped 7.1 percent in January to a pace of 1.04 million, and are 8.8 percent below a year ago. The median price in the Midwest was $140,300, which is 7.6 percent higher than January 2013.
In the South, existing-home sales declined 3.5 percent to an annual level of 1.95 million in January, but are 1.6 percent higher than January 2013. The median price in the South was $161,500, up 9.4 percent from a year ago. Existing-home sales in the West dropped 7.3 percent to a pace of 1.01 million in January, and are 13.7 percent below a year ago. Sales in the West are attenuated by tight inventory in many areas, pushing the median price to $273,500, up 14.6 percent from January 2013.
Here are our overviews of existing home sales not revised.
American Nightmare
Not as many people can afford to buy houses. The end. No really, it is the end of the middle class. While economists of every stripe continue to argue for the importance of rising prices of real estate, their value as housing seems to be ignored completely. Look around the neighborhood where you grew up, does your pay make a home that has gone up in price 25 times what it was 20 years ago magically more affordable? No. If anyone cares to explain Dean Baker, for example, I'm all eyes.