
Last week we received the last data for housing through February. New home sales as reported by both the Census Bureau and the NAR ticked up on a seasonally adjusted basis, but have not yet broken trend - a trend that would take them to zero by this time next year!
I've laid out my scenario for the housing market in transition in several posts beginning last December, on Feb. 27 for new home sales, and on March 16 for existing home sales. As of March 17, Calculated Risk adopted the virtually identical analysis.
While there are certainly other bloggers who get many more page views than I do, and there has been much commentary on the February sales data, there is a nugget of interesting information that nobody else has teased out of existing home sales.
Mainly the commentariat has explained that existing home sales haven't hit bottom. But as I've noted several times already, for the last 6 months, they've been almost equal to sales of a year previous. I've put that information together for you in this table:
| Month | YoY % Change | rolling 6 mo. avg YoY % change |
|---|---|---|
| 2/2009 | (-4.6%) | (-4.2%) |
| 1/2009 | (-8.6%) | |
| 12/2008 | (-3.5%) | |
| 11/2008 | (-10.6%) | (-8.4%) |
| 10/2008 | (-1.6%) | |
| 9/2008 | +1.4% | |
| 8/2008 | (-10.7%) | (-15.3%) |
| 7/2008 | (-13.2%) | |
| 6/2008 | (-15.5%) | |
| 5/2008 | (-15.9%) | (-20.3%) |
| 4/2008 | (-17.5%) | |
| 3/2008 | (-19.3%) | |
| 2/2008 | (-23.8%) | |
| 1/2008 | (-23.4%) | 12/2007 | (- 22.0 %) |
The middle column compares sales volume from e.g., February 2009 with that of 2008. The trend is pretty obvious.
The column on the right averages sales volumes for the six months up to and including the month posted. I've done this for 3 month intervals to make the trend smoother and stand out more. As you can see, averaged over 6 months, the rate of change of housing sales has decreased ~5%. If the trend were to continue, YoY sales from 12/2008 - 5/2009 would be virtually identical to the year before, forming a bottom.
I am grateful to Tim Iacono of The Mess that Greenspan Made who has prepared a graph showing the data in the middle column:
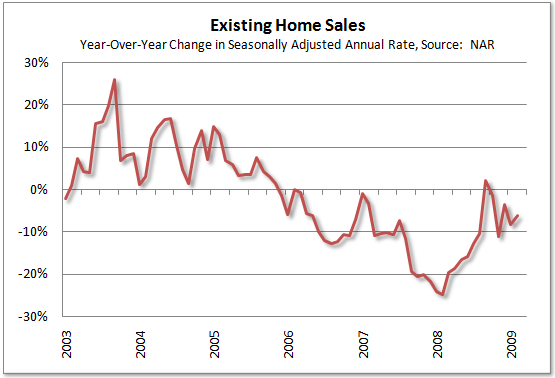
(Please note that Tim has used NAR revised data and expanded the date range, whereas I have used the unrevised data. Either way the results are similar).
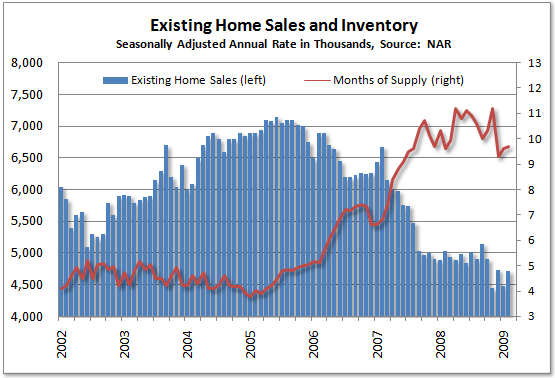
I doubt the breakeven point will come so quickly. This graph, also fromTim Iacono, shows that existing home sales, after trending sideways for nearly a year at 2.8m-3.0m units, decreased by about .3m in the wake of Black September.
As I indicated in my last post, at least in terms of sales of smaller items, consumers appear to have almost completely recovered. Sales of large price-tag items like houses and cars have not. It will nevertheless be interesting to see if the effect of Black September abates as to these items as well in the coming few months. In summary, however, barring another Oil price shock or 401k shock, it appears that the volume of existing home sales will bottom at some point this year.
Comments
What will happen when $700 billion in
mortgages are due to reset in 2010 and possibly more in 2011? I know it is unpopular but we have not fully addressed the mortgage crisis. We need to refinance these ticking time bombs to fix rate mortgages.
Is there any correlation between supply and amount of ARM resetting?
RebelCapitalist.com - Financial Information for the Rest of Us.
That will impact price
There is a school of thought that these re-sets won't amount to that big a deal, because so many have already been renegotiated.
Whether or not that is true, will probably affect price declines and indirectly volume, but shouldn't depress volume in the future. The more distress sales drive prices down, the higher volume will be (as able buyers begin to scoop up bargains).
Also, the impact of resetting may not be that great
if most indexes for the ARM remain low. But I am not sure they will remain low for too long.
RebelCapitalist.com - Financial Information for the Rest of Us.
if it hasn't been done
I honestly do not know but if a modified ARM reset schedule bar graph hasn't been done with the volume, might be an excellent research project as well as some muckraking, much ado about "helping the homeowner"...proof is partially in the reset schedule.
arm reset schedule
Good question. The last ARM reset schedule is here
(second image, has a zoom) and as far as I know we're at month 24.
The thing is a host of refinancing "programs" are out there so this bar graph map is out of date. What's the volume now to reset?
Also, what's the subprime left overs for I believe those in volume have dropped considerably.
Message to all other blogs, reporters, writers
Please have the decency to cite New Deal Democrat and his original analysis work if you use it in your own posts. It is extremely uncool to not reference someone else's work.
We reference, with links, pointing to the source we got it from, other people's work as appropriate, please do the same.
"We're nowhere near a bottom in housing"
My buddy Bonddad just put up another post with that title, discussing the January Case/Schiller index, which plummeted 19%+ YoY.
So, do we disagree? No. Bonddad is referencing price (and I agree), whereas I am referencing volume.
This is headline news?
Seattle home prices to 2005 levels is the headline in the Google news aggregator.
Seriously, big deal that means it's dropped to over-inflated levels that are a good decade away in prices from where they should be.
Google I swear promotes stories based on "something" other than what is important news of the day.
Lag between sales and prices?
Does anyone know the typical spread? And will this time be typical?
For anyone thinking about buying a house, I'd say don't worry about timing the bottom, prices will stay there a while.