
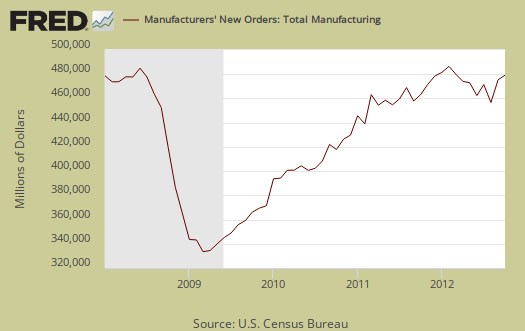
The Manufacturers' Shipments, Inventories, and Orders report shows factory new orders increased 0.8% for October. September showed a 4.5% increase whereas August had a -5.1% decline. This Census statistical release is called Factory Orders by the press and covers both durable and non-durable manufacturing orders, shipments and inventories.
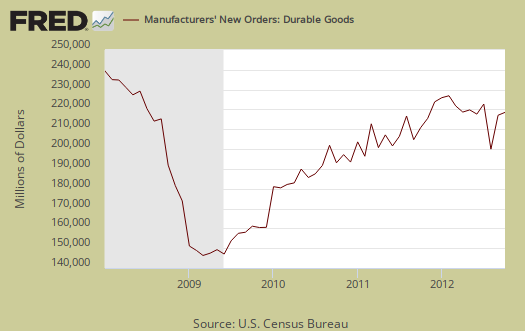
Manufactured durable goods new orders, increased 0.5% for October. September durable goods showed a 9.1% increase whereas August had a -13.1% plunge in durable goods new orders. Machinery alone showed a 4.6% jump in new orders. Nondurable goods new orders increased 1.1% for October.
Transportation equipment's new orders dropped -2.3% on nondefense aircraft & parts. Motor vehicles & parts increased 3.0% in new orders.
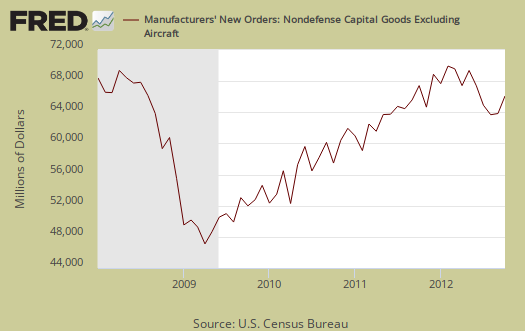
Core capital goods new orders increased 2.9% for the month a nice improvement from September's -0.5% decline. Core capital goods are capital or business investment goods and excludes defense and aircraft.
Graphed below are the revised durable goods news orders. Markets jump on the advance report for durable goods new orders, even though it is revised almost always a week later as statistics are more complete for the month. Notice that durable goods new orders are below pre-recession 2008 levels.
Shipments overall increased 0.4% and September's shipments showed a 0.7% increase. Durable goods shipments declined -0.4% while nondurables increased 1.1% on a 1.9% increase on coal and petroleum shipments. Core capital goods shipments declined -0.1% and have declined the last three months, September -0.3% and August core capital goods shipments dropped -1.1%. Below is a graph of core capital goods shipments.

Inventories for manufacturing overall increased 0.1%. Core capital goods inventories increased 0.1%. Inventories of manufactured durable goods increased 0.4%. Nondurable goods inventories declined -0.5% on a -2.3% decrease on Petroleum & Coal inventories.
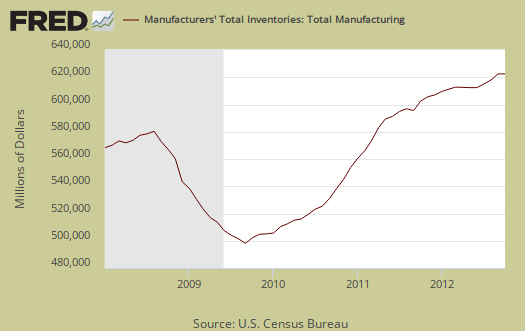
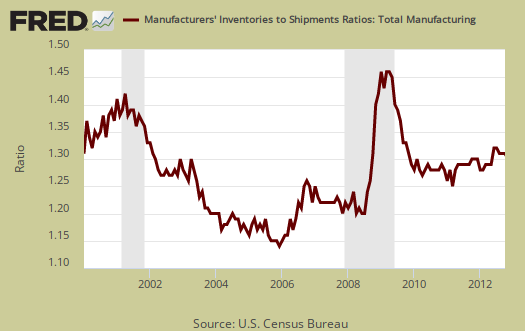
The inventory to shipments ratio is 1.28, unchanged from September.
Unfilled Orders increased 0.3% overall with durable goods also having a 0.3% increase in unfilled orders. The statistic which stood out was industrial machinery, which had a -4.5% drop in unfilled orders and has declined the past three months.
Part of this report goes into calculating GDP. The BEA takes this report, called M3, and uses the shipments values to calculate investment in private equipment, investment in software. Manufacturing inventories also goes into the changes in private inventories GDP calculation. At the bottom of this post is a little more information to estimate part of the GDP investment component.
The St. Louis Federal Reserve FRED graphing system has added individual NAICS data series from this report. If you're looking for a graph of some particular NAICS category, such as light trucks, autos & parts, or machinery, it might be found on FRED. Most news outlets source the Commerce Department, while technically correct, also makes it impossible for you, our beloved detailed reader, to find the actual statistical report and data. We like to link directly to the statistical release and cite who actually is issuing those statistics.
Recent comments