
The Federal Reserve Industrial Production & Capacity Utilization report shows industrial production increased 0.1% while January was revised downward to a -0.3% decline. December was also revised down to -0.2%. Manufacturing alone declined by -0.2% and January's manufacturing production was also revised downward from +0.2% to -0.3%. This is the 3rd month in a row for a decline in manufacturing output as December's contraction was -0.1%. Utilities jumped up 7.3% on snow apocalypses. Mining, which includes oil, took another hit and decreased by -2.5%. The G.17 industrial production statistical release is also known as output for factories and mines.
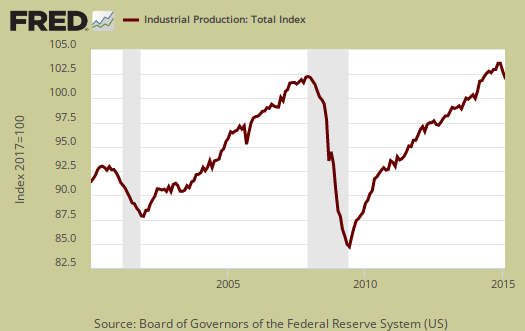
Total industrial production has now increased 3.5% from a year ago and this yearly gain is much lower than last month. Currently industrial production is 5.8 percentage points above the 2007 average. Below is graph of overall industrial production's percent change from a year ago.

Here are the major industry groups industrial production percentage changes from a year ago.
- Manufacturing: +3.4%
- Mining: +5.3%
- Utilities: +1.3%
Manufacturing output is 1.3 percentage points above it's 2007 Levels.

Within manufacturing, durable goods was hammered, decreasing - 0.6% for the month. Motor vehicles & parts declined by a whopping -3.0% for the month but there were also other monthly declines. Aerospace increased 1.2%.

Nondurable goods manufacturing showed a 0.2% gain for the month as petroleum and coal products gained 1.9%.

Mining showed a -2.5% monthly decrease. Mining includes gas and electricity production and the Fed have a special aggregate index for oil and gas well drilling. Oil and gas well drilling dropped a whopping -17.3% and for the year is down -21.4%. That's gotta hurt and assuredly is making an impact in the previous North Dakota boom town miracle.

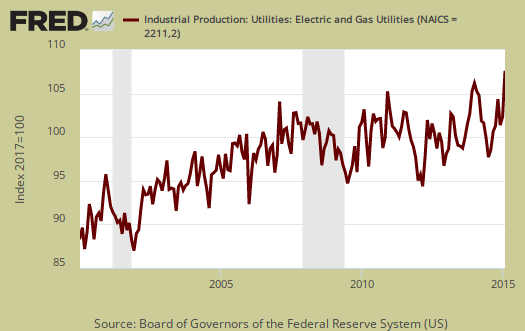
Utilities are volatile due to weather and why the below graph shows the wild swings. One can track the polar vortexes and heat waves in the below graph.
There are two reporting methodologies in the industrial production statistical release, market groups and industry groups. Market groups is output bundled together by market categories, such as business equipment or consumer goods and shown below:
Among the major market groups, the indexes for consumer goods, for defense and space equipment, and for business supplies registered gains in February, while losses were recorded by business equipment, construction supplies, and materials. The index for consumer goods moved up 1.0 percent, with the increase more than accounted for by a gain of 7.6 percent for consumer energy products, which reflected a jump in sales to consumers by utilities. The output of durable consumer goods dropped 1.4 percent, and the production of non-energy nondurables decreased 0.2 percent. The output of business equipment declined 0.3 percent, with an increase for transit equipment and decreases for information processing equipment and for industrial and other equipment. The index for materials declined 0.2 percent, with a drop of 0.8 percent in the output of durable materials partially offset by small gains for both nondurable materials and energy materials.
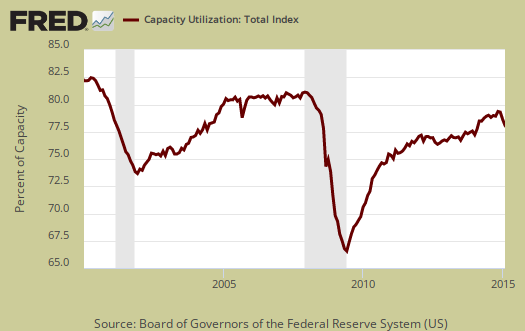
Capacity utilization, or of raw capacity, how much is being used, for total industry is 78.9%, a decline of -0.2 percentage points from last month. . Capacity utilization has increased 0.3 percentage points from a year ago,so utilization has barely budged. Manufacturing capacity utilization is 77.3% and is 0.9 percentage points higher than a year ago with the month showing a -0.3 percentage point decline. Mining capacity utilization is 84.6% and is down -2.6 percentage points from a year ago. Utilities use of it's capacity is 84.5% and has gained 0.3 percentage points from a year ago. Manufacturing capacity is still -1.3 percentage points below the long term average (1972-2014, see table 7). From the report:
The operating rate for durable goods manufacturing moved down 0.7 percentage point to 76.9 percent, just below its long-run average, and the operating rate for nondurable goods manufacturing edged up 0.1 percentage point to 79.5 percent, about 1 percentage point below its long-run average.
Capacity utilization is how much can we make vs. how much are we currently using, of what capacity is available now, or output rate. Capacity utilization is also called the operating rate. Capacity utilization is industrial production divided by raw capacity.
Capacity growth is raw capacity and not to be confused what what is being utilized. Instead, this is the actual growth or potential to produce. Capacity is the overall level of plants, production facilities, and ability to make stuff, that we currently have in the United States. Capacity growth overall has increased 3.1 percentage points from a year ago and the same as last month. Below is the capacity growth increase from a year ago of the subcategories which make up industrial production.
- Manufacturing: +2.1%
- Mining: +8.9%
- Utilities: +0.9%
Below is the Manufacturing capacity utilization graph, normalized to 2007 raw capacity levels, going back to the 1990's. Here is where offshore outsourcing really shows up. Pay particular attention to the 2001-2003 as manufacturing had a mass exodus to China after passage of the bad trade deal in 2000.

Overall there are some warning signs here that the economy is not quite so humming as it out to be, that things are slowing down, abet still with growth.
Here are our previous overviews, only graphs revised. The Federal Reserve releases detailed tables for more data, metrics not mentioned in this overview.
Recent comments