
The Mortgage Monitor (pdf) from Black Knight Financial Services (BKFS, formerly LPS Data & Analytics) is a mostly graphics presentation that covers a variety of mortgage related issues each month. After summarizing the monthly stats, we'll take a look at a few of the graphics from this month's section on foreclosures.
The Mortgage Monitor for January (pdf) reported that there were 814,513 home mortgages, or 1.61% of all mortgages outstanding, remaining in the foreclosure process at the end of January, down from 820,177 at the end of December, which was also 1.61% of all active loans that were in foreclosure, as the active loan count fell by a like percentage. Nonetheless, this was still down 31.42% from the 1,175,470, or 2.35% of all mortgages that were in foreclosure in January of last year. These are homeowners who had a foreclosure notice served but whose homes had not yet been seized, and this recent "foreclosure inventory" remains the lowest percentage of homes that were in the foreclosure process since early 2008. New foreclosure starts, however, rose to 94,347 in January, the highest level since December 2013. up from 89,357 the prior month and from 73,862 in November, and up from the 94,075 foreclosures started in January a year ago...
In addition to homes in foreclosure, January BKFS data showed that 5.56% of all mortgages, or 2,813,257 mortgage loans, were at least one mortgage payment overdue but not in foreclosure, down from 5.64% of homeowners with a mortgage who were more than 30 days behind in December, and down from the mortgage delinquency rate of 6.27% a year earlier. Of those who were delinquent in January, 1,111,816 home owners, or 2.20% of those with a mortgage, were considered seriously delinquent, which means they were more than 90 days behind on mortgage payments, but still not in foreclosure at the end of the month. Thus, a total of 7.17% of homeowners with a mortgage were either late in paying or in foreclosure at the end of January, and 3.81% of them were in serious trouble, ie, either "seriously delinquent" or already in foreclosure at month end..
The first graph below, from page 6 of the mortgage monitor, shows the count of foreclosure starts as they occurred in each month since the beginning of 2008, wherein each bar represents a month and within each bar we have foreclosure starts on mortgages that have never been in trouble previously in blue, and in red foreclosure starts on mortgages that had been in foreclosure at least once before, resolved that prior to a foreclosure sale either through a modification, or by making a payment to get caught up on their loan, only to fall behind on payments again and end up in foreclosure yet another time. The green line on the graphs then shows repeat foreclosures as a percentage of total foreclosure starts for the month, which has once again risen to more than half of all foreclosures, as a large number of those who've had their mortgage modified are now in foreclosure again. As the callout on the graph notes, repeat foreclosures, being up 11% over December's level, was the primary reason that January foreclosure starts rose.. Nonetheless, both new and repeat foreclosures were at a 12 month high..

The next graph, from page 8 of the mortgage monitor, shows us the difference between first time foreclosures and repeat foreclosures in the average length of a mortgage delinquency for each until a foreclosure is initiated, again since early 2008. The blue line shows the average number of months that a previously foreclosed home had been delinquent before a second (or additional) foreclosure was initiated over that period; the red line shows the average number of months that a previously unencumbered home mortgage was delinquent before the first foreclosure was started on it over that same time span, and the black line shows the average number of months the total universe of foreclosed homes was delinquent over the period from 2008 to the present. We can see that prior to 2013, the time of delinquency until the first foreclosure was averaging 6 or 7 months, then, after the issuance of dual tracking regulation by the CFPB, which prohibited the industry practice of foreclosing on homeowners while a mortgage modification was being worked out, after which time it jumped to 14.6 months. However, the time the industry will work with homeowners for a solution has now dropped back to 9.1 months as of this report.

The next graph, also from page 8 of the mortgage monitor, shows on the left margin the number of mortgages that had a foreclosure initiated against them for each month over the same time period covered by the previous graphs, with the foreclosures starts occurring over that period divided into the number of months delinquent for each indicated by a color coded line. Thus, the brown line show the number of 2 month delinquent mortgages that had a foreclosure started on them each month, the purple line show the number of 3 month delinquent mortgages that had a foreclosure started on them each month, the teal blue line show the number of 4 month delinquent mortgages that had a foreclosure started, the orange line show the number of 5 month delinquent mortgages that had a foreclosure started, and the darker blue line show the number of mortgages that were delinquent for 6 months or more before they had a foreclosure started against them. Here we can see that prior to 2010, the large majority of foreclosures were being initiated after 3 months of delinquency, with only a few homeowners going 5 or 6 months before a foreclosure notice was delivered, but that after 2010, the lion's share of mortgages were delinquent for 6 months or more before they had a foreclosure started. Also note that after dual tracking legislation was put in place, the number of 3 month delinquent mortgages that saw foreclosure fell precipitously, and mortgages being foreclosed after just 2 months without a house payment virtually stopped.

The next graph, as its heading indicates, shows the foreclosure pipeline ratio over time, in this case going back to 2005.. You might recall that the pipeline ratio is a mortgage industry metric indicating how many months the average troubled home loan typically remains in the foreclosure process in each state, and it is computed by adding those homes that are seriously delinquent to those already in foreclosure and dividing that sum by the average number of completed foreclosures per month in each state over the previous 6 months. What that results in is the average number of months a problem home loan would be in the "foreclosure pipeline" at the current pace of foreclosure in each state, before the foreclosure process on all seriously delinquent homes would be completed. So the graph below, from page 10 of the Mortgage Monitor, shows the historical pipeline ratio for judicial states, where a court proceeding is necessary to complete a foreclosure, in blue, and the same ratio in non-judicial states, where such a proceeding isn't necessary for the banks to take possession of the home, in red. Obviously, early on in the crisis, the process was much longer for judicial states, with their average reaching 118 months and with the foreclosure pipeline ratios reaching 50 years for New York and New Jersey, but as we can see on the graph, the difference in this between the types of states has closed, as judicial states have moved to speed up the process. Even so, the pipeline ratio now averages more than 4 years for both types of states; 58 months for judicial states, and 53 months for non-judicial states, and the time has generally rising for both types of foreclosure process over the last year. The reason for the increase in the foreclosure pipelines recently is not so much delays in court anymore, but procrastination on the part of the mortgage servicers and banks, possibly because of defective titles, but also possibly because they've experienced quite a bit of deterioration in the properties they've already seized, and would rather leave them occupied by delinquent homeowners than vacant and ravaged by vandals...

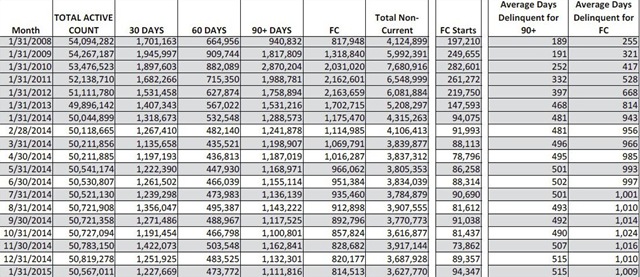
Last, we'll again include part of the Mortgage Monitor table showing the monthly count of active home mortgage loans and their delinquency status, which comes from page 15 of the pdf. The columns here show the total active mortgage loan count nationally for each month given, number of mortgages that were delinquent by more than 90 days but not yet in foreclosure, the monthly count of those mortgages that are in the foreclosure process (FC), the total non-current mortgages, including those that just missed one or two payments, and then the number of foreclosure starts for each month the past year and for each January shown going back to January 2008. In the last two columns, we see the average length of time that those who have been more than 90 days delinquent have remained in their homes without foreclosure, and then the average number of days those in foreclosure have been stuck in that process because of the lengthy foreclosure pipelines. Notice that the average length of delinquency for those who have been more than 90 days delinquent without foreclosure has begun to increase slightly and is now at 515 days, while the average time delinquent for those who’ve been in foreclosure without a resolution is off its recent record high but is still nearly three years at 1009 days.

NB: a copy of the full version of the above table, which also shows the monthly loan counts for 30 and 60 day delinquencies, is here..
(the above was first posted at Marketwatch 666)
Comments
that's amazing
4 years out, that's a long time to live rent free, assuming you can pay utilities still, but there are also property taxes, sometimes so outrageous people cannot afford even those.
very little coverage
i've covered this report for years while almost no one else does (just McBride and a few housing sites)...this situation should be a major issue, but it somehow stays under the radar...
rjs