
The February 2012 S&P Case Shiller home price index shows a -3.5% decline from a year ago over 20 metropolitan housing markets and a -3.6% decline for the top 10 housing markets from February 2011. Home prices are back to November 2002 levels for the composite-20 and April 2003 for the composite-10 and are new lows, not seasonally adjusted. Both composites are now down -35% from their 2006 home price bubble peaks. Below is the yearly percent change in the composite-10 and composite-20 Case-Shiller Indices. These are not seasonally adjusted, but comparing from February 2011.

The burning of Atlanta continues with a new home price historic low. From S&P, using not seasonally adjusted data:
Atlanta had the only double-digit negative annual at -17.3%. This was the fifth consecutive month of doub le-digit negative returns for Atlanta and the lowest
annual return in its 20-year history..
Atlanta's foreclosures were 48% of all sales in February and has the highest number of government foreclosures of any city.
News headlines on the S&P Case-Shiller Housing Index often differ. Some in the press use the seasonally adjusted data, and others do not. S&P themselves use the not seasonally adjusted housing price data. To make matters worse, some in the press compare just the monthly not seasonally adjusted data and others compare the housing price index to one year ago, without telling you what number they are quoting from S&P. That's why on this site we make sure you know which apple you're looking at, all data is identified. For more details on seasonal adjustments, see the bottom paragraphs of this overview.
This month the not seasonally adjusted January to February change for the composite-20 was -0.8%. The seasonally adjusted composite-20 monthly change was +0.2%. The composite-10 not seasonally adjusted monthly change was -0.8% and the seasonally adjusted composite-10 monthly change was +0.1%. Intuitively, the divergence of the seasonal adjustments in winter makes sense. The housing season is over.

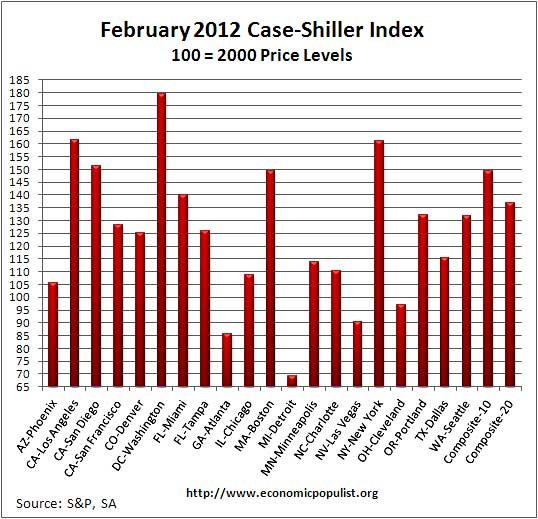
The above graph shows the composite-10 and composite-20 city home prices indexes, seasonally adjusted. Prices are normalized to the year 2000. The index value of 150 means single family housing prices have appreciated, or increased 50% since 2000 in that particular region. These indices are not adjusted for inflation. The composite-20 index, seasonally adjusted is 136.71 and comparable to January 2003 levels (ignoring 2009). Not seasonally adjusted the composite-20 index is 134.20, between October 2002 and November 2002 levels. Clearly the bottom in home prices has not been reached.
Below are the seasonally adjusted indices for this month and reads like the only ones not getting hammered with low home prices are politicians, wall street types and hollyweird.
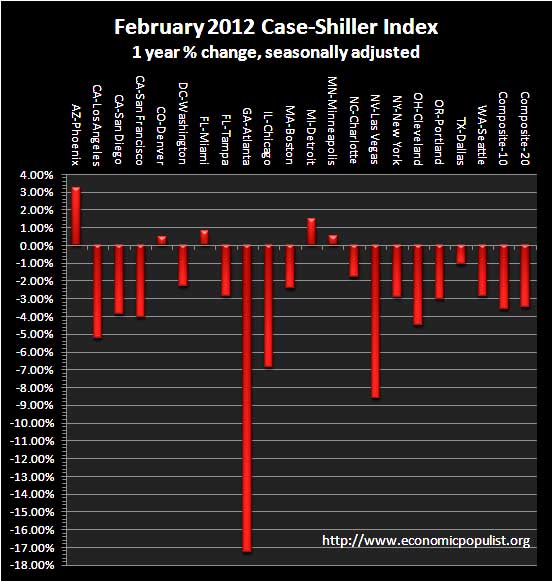
Below are all of the composite-20 index cities yearly price percentage change, using the seasonally adjusted data. Anyway you slice it, Atlanta has imploded in home prices. The dramatic decline overshadows the losses in other cities, like the never ending Las Vegas housing implosion and the declines in Chicago. While Phoenix looks good, bear in mind not seasonally adjusted Phoenix is down 54.2% from its peak.
When it comes to annual data, the seasonally adjusted and not seasonally adjusted should start to converge. There are those in the press so wishing the housing bottom was reached, they will attempt to spin any number, any report. The data from every direction tells us residential housing is not quite done in it's great slide back from casino chip to actual place to live. Reuters got the straight dope from Robert Shiller:
The Housing market is likely to remain weak and may take a generation or more to rebound, Yale economics professor Robert Shiller told Reuters Insider on Tuesday.
Shiller, the co-creator of the Standard & Poor's/Case-Shiller home price index, said a weak labor market, high gas prices and a general sense of unease among consumers was outweighing low mortgage rates and would likely keep a lid on prices for the foreseeable future.
"I worry that we might not see a really major turnaround in our lifetimes," Shiller said.
To Season or Not to Season, That is the Question:
The S&P/Case-Shiller Home Price Indices are calculated monthly using a three-month moving average and published with a two month lag. Their seasonal adjustment calculation is the standard used for all seasonal adjustments, the X-12 ARIMA, maintained by the Census.
So, why would S&P report the not seasonally adjusted data? According to their paper on seasonal adjustments, they claim the not seasonally adjusted indices are more accurate. It appears the housing bubble burst screwed up the cyclical seasonal pattern. What a surprise, although those steep cliff dives are now going back to 2009, one would think the seasonally adjusted data would now start to converge back to it's cyclical, seasonal pattern.
The turmoil in the housing market in the last few years has generated unusual movements that are easily mistaken for shifts in the normal seasonal patterns, resulting in larger seasonal adjustments and misleading results.
Not seasonally adjusted data can create more headline buzz on a month by month basis due to the seasonality of the housing market. S&P does make it clear that data should be compared to a year ago, to remove seasonal patterns, yet claims monthly percentage changes should use not seasonally adjusted indices and data. This seems more invalid than dealing with the statistical anomalies the massive housing bubble burst caused.
For more Information:
For more analysis, we recommend Calculated Risk, who does correct, extreme analysis and graphing on Case-Shiller data.
S&P does a great job of making the Case-Shiller data and details available for further information and analysis on their website.
Here is our overview from last month.
Recent comments