
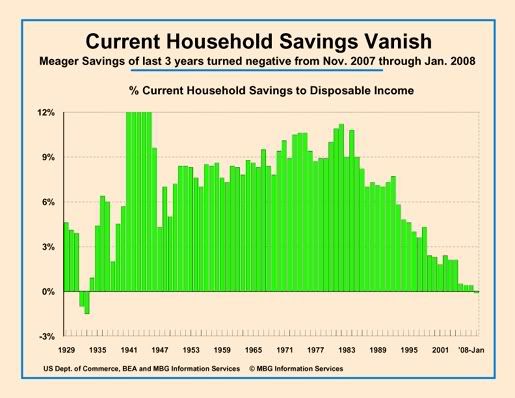
Despite no real change in January spending, for the first time on record households spent more than all current incomes for the 3rd consecutive month.
Today’s BEA report on personal income and spending shows that price-adjusted household spending was unchanged in January. Nevertheless, total household spending in January was more than ALL after-tax incomes as households again dipped into savings or fell deeper into debt for a record third consecutive month.
Note that these are not “median” figures but total income and spending for ALL households including those few that received very large bonuses in January.
For the past three years meager household savings rates have been the lowest since the worst of the Great Depression in 1933. But in monthly records back to 1959, (and almost certainly back to 1933,) total household spending never exceeded current income until the one month of October 2001, in the shopping frenzy that followed the attack of Sept. 11, 2001. There was also one month of dis-savings in August 2005 as incomes plunged in the wake of Katrina and other disasters along the Gulf coast. Two consecutive months of dis-savings occurred only once before, in July and August 2006 as gasoline prices briefly spiked.
Today’s report shows November and December incomes revised down sharply with spending also revised down (although by less than incomes) in November and little changed in December. The result is that dis-savings plunged to -0.3% of disposable incomes in November and -0.1% in both December and January.
January is always an unusual month for incomes and today’s report shows that January 2008 was no exception. What BEA describes as large bonus payments including the exercise of stock options among debt industry salesmen and their “analysts” account for 64% of the income gain in January. This information, vital to actually understanding today’s income picture, is unlikely to be reported and will certainly not be disclosed by any of the debt industry beneficiaries or their retainers.
Even with these rich bonuses, total personal income fell -0.1% behind inflation in January (0.27% for nominal income growth vs. 0.37% rise in prices) meaning that the vast majority of households suffered a sharp decline in price-adjusted income in January.
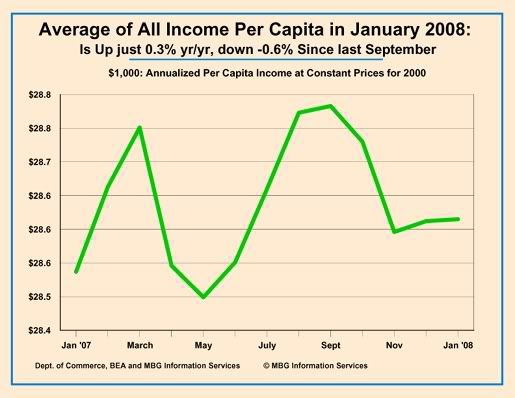
But because payment of estimated taxes plunged in January, total tax payments fell by almost -1.0% boosting total after-tax disposable incomes to a real gain of near 0.1% keeping up with the growth in population. This left the average real per-capita disposable income almost unchanged in January, up just 0.3% yr/yr and -0.6% lower than last September.
But remember: because of very large bonuses payments to a few, even these dismal “average” income data grossly understate conditions for the vast majority of households.
Today’s report of record levels of dis-savings and stagnant or falling real incomes and spending is yet another indicator that the wildly debt-dependent US households are under very severe financial stress at a time when the value of their (highly leveraged) home is also falling rapidly. What will it take before voters are willing and able to overcome the all-powerful debt industry interests and to demand policy actions proportionate to the massive mess we face?
Comments
It's More Than the Debt Industry
Debt industry regulation is an important step, but others are needed. The biggest underlying source of consumer debt is rising income inequity. The second biggest is the economic damage caused by the war on Iraq.
People have less money so they are borrowing just to try to keep up with their past living standards. Our nation will have to abandon corporate controlled trade and make the rich pay their fair share in taxes. The war will have to be put to an end too.
By the way, you will get more comments with a gentler Captcha.