
I have been saying for a long time now that housing was a leading component of the economy. Housing peaked in late 2005 - early 2006, long before the recession started in December 2007. Just as clearly, it is likely that housing will bottom first, and will be a primary component leading us out of this "Great Recession." By now housing is so far into the downturn that we ought to be able to make educated projections about housing prices and sales over the next several years.
Recently I noted that new home sales are falling so fast that they almost have to bottom this year - or come very close - unless you think that new homes sales will be 0 by early 2010!
But new home sales are a smaller part of the housing market. Existing home sales are much larger. In this post I will examine what I think are reasonable projections about the volume and prices of new home sales in 2009-2010 and beyond.
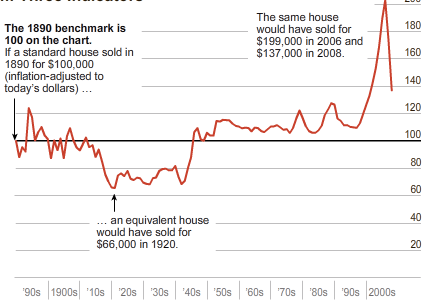
Readers may recall the graph (updated below) of inflation adjusted home prices from 1890 on, originally published by Robert Schiller in the 2005 udpate of his book, "Irrational Exhuberance" (reprinted by the New York Times):
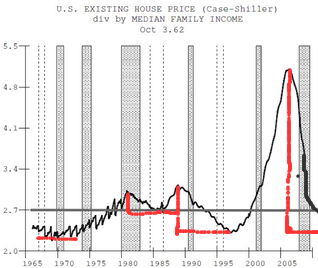
Here is a similar graph of median house prices as a multiple of median household income, updated through October 2008:
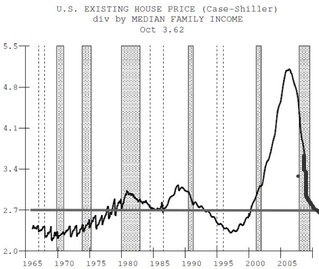
In October 2008,. the multiple stood at 3.62. Since that time the Case Schiller index has declined -2.2 in November and -2.5% in December, meaning that the median house now costs ~3.44 times median income (as reflected in the gray continuation). If housing prices decline in 2009 as they did in 2008, then we will reach the 2.7 long term average by the end of this year, and it is reasonable to project a more gradual decline towards the previous long term bottoms of ~2.25 in 2010 and beyond (also estimated in the gray continuation).
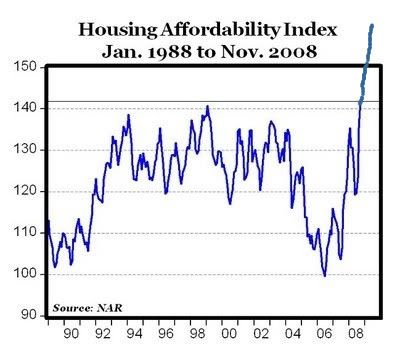
As the price of existing housing stock declines as a multiple of income, housing has become much more affordable. The "Housing Affordability Index" of the National Association of Realtors, which estimates how much the median income household can afford of existing housing stock with 20% down and an 80% traditional mortgage, already shows that housing has become much more affordable, on that basis, than at any time in the last 30 years. The graph below shows data through October 2008. The blue continuation line shows the January 2009 reading of 166.8:
So, why hasn't there been a boom in home-buying? First of all, the growth in the early part of the decade represented a glut on the market, a glut that is now one of foreclosures. Secondly, with home prices declining at 15%-20% a year, why buy now when the same house, or one just like it, will be ~10% cheaper in 6 months? -- and that assumes the buyers are in good financial condition themselves, which due to rising unemployment, decreasing 401K values, and a significant part of the population being "underwater" in their home equity, is needless to say a stretch!
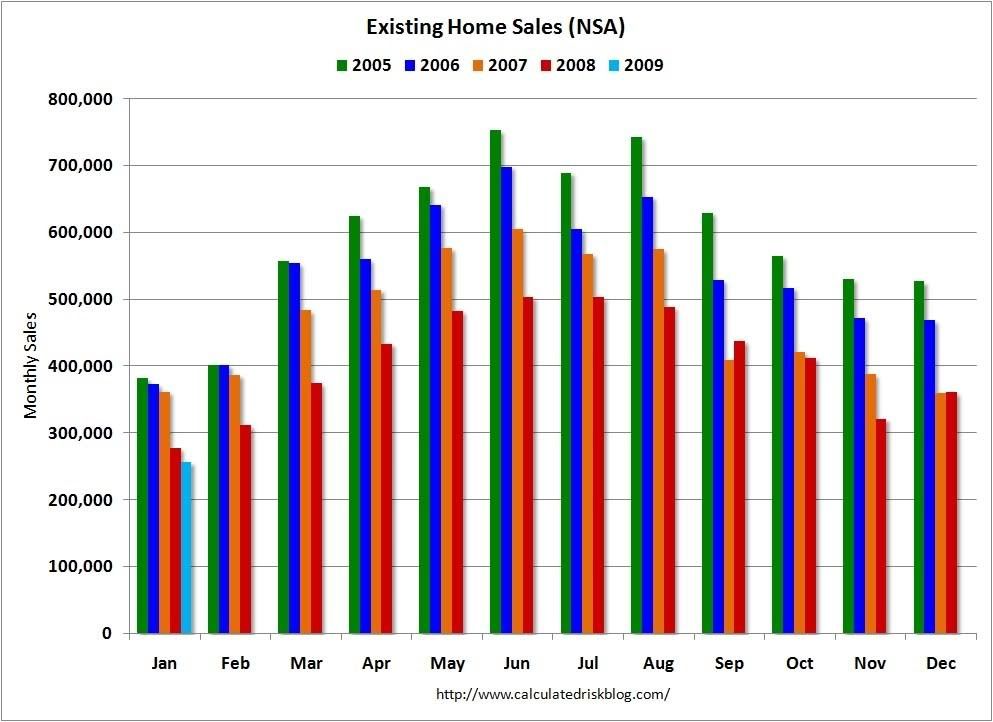
Nevertheless, with housing becoming more affordable, in the last 5 months the volume of existing home sales has nearly equaled or even slightly surpassed the level of existing home sales from a year ago, as shown on this graph courtesy of Calculated Risk:
Months' supply of existing houses has also declined from over 11 months to ~9.5 months, closer to the historic 6-7 months metric under which houses tend to rise in price.
Depending on whether the volume of existing home sales continues to stabilize, or whether that volume declines to previous lows, we can generate a range on a graph of existing home sales, as shown here:
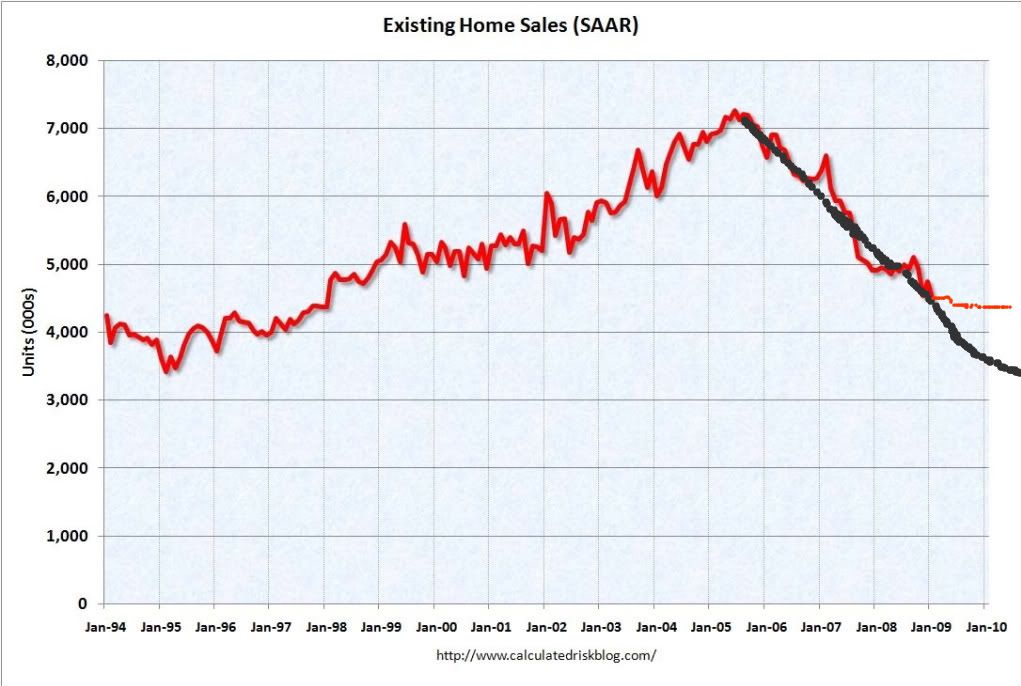
If existing home sales stabilize now, the orange continuation will best describe sales in 2009-2010. If sales decline to a longer-term low, the gray continuation line is a better estimate. Either way, it appears that the volume of existing home sales will approach bottom later this year or next year.
Price is another matter entirely. At least in terms of price as a ratio of median income, I expect the decline to continue for several more years. Here is the graph of median home prices as a multiple of median income, showing how declines tend to occur more slowly than advances, with bottoms occuring somewhere near a ~2.25 multiple of median income. Even if volume begins to pick up by next year, it is reasonable to believe there will continue to be a longer period of slight declines until prices form a bottom. I have run out of room to graph this below:
We might expect that at some point in the next few years, after a recovery, there will be another inflationary spike, with a spike in mortgage rates, which will form this long-term bottom, roughly coincident with the long-term stock market bottom I wrote about last week.
To summarize:
- existing home prices are falling at a rate of 15%-20% a year.
- at that rate, house prices will fall to their long term median by the end of this year (and would fall to 0 by 2013!)
- low mortgage rates are making those houses historically affordable (on a monthly mortgage payment basis).
- volume of existing home sales is showing signs of stabilization
- stabilization of sales volumes almost certainly will occur by the end of 2010 (and on a non-seasonal basis, may possibly already have hit bottom in January 2009)
- house prices as a multiple of median income will nevertheless continue to decline, albeit more slowly, for several more years before hitting bottom, perhaps ~2015.
-----
P.S. Andy Bebut a/k/a Theroxylandr is another blogger who makes use of the Kondratieff interest rate cycle in his analysis. He has a post up about Housing, stocks, and Kondratieff Winter which is well worth reading for a similar approach to mine, reaching some similar conclusions about financial markets and housing. I'm sure he'd appreciate the traffic.
Comments
I suspect
New home sales will HAVE to hit zero. The leading indicator for me is foreclosure sales in shrinking population markets like Detroit. IF one can live anywhere (and arguably, in a post-industrial job, one can- it's not THAT hard to telecomute), why would anybody buy a McMansion for $1 million in California, when they could have the EXACT SAME HOUSE for $10,000 in Detroit?
-------------------------------------
Moral hazards would not exist in a system designed to eliminate fraud.
-------------------------------------
Maximum jobs, not maximum profits.
Great analysis NDD!
I'm so glad to see housing prices analyzed by the median income too. I think it is also most useful you mentioned at some point to avoid massive inflation, the Fed will have to raise interest rates as well as reduce the money supply.
I have another area that probably needs some government reform and that is credit scores.
It's like a hidden big brother the way these companies are scoring people and if they continue to make it more difficult for people to buy a home, to get out of their debt, I imagine the ability to get credit is going to be an additional factor.
i.e. that 20% down is going to 25% interest rates instead and the ability of these companies to just magically change someone's credit score in addition to these credit card companies charging loan shark rates is another consumer 'bleed 'em'.
BTW: the glut it's just pathetic, we have various corporate lobbyists and their puppets claiming that we should bring in more temporary guest workers, as if a temporary guest worker is going to buy a home and they also ignore how U.S. citizens are losing their jobs by this method, i.e. it's a direct replacement of labor so it represses income per that occupational area plus the U.S. citizen displaces....will probably lose their home. In other words, it's worker substitution...
not exactly growing the population who have stable income and can commit to a 30 year mortgage.
Believe this or not, Mr. huge cause of this debacle, Alan Greenspan is spewing this absurdity as policy.