
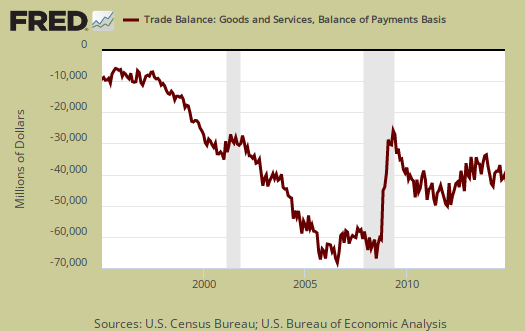
The U.S. November 2014 monthly trade deficit declined -7.7% from last month and now stands at -$39 billion. America still runs a surplus in services, now at $19.3 billion, but the goods deficit is still massive and this month was -$58.3 billion. This month's trade deficit reduction is due to less crude oil imports and lower oil prices. The U.S. trade deficit hasn't been this low since December 2013.
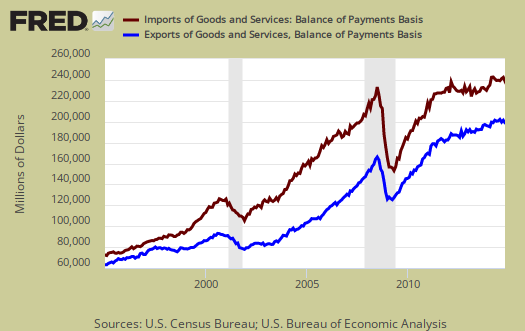
Graphed below are imports and exports graphed and by volume since 1995 and note the global trade collapse in 2009. Imports are in maroon and exports are shown in blue, both scaled to the left.
Below are the goods import monthly changes, seasonally adjusted. On a Census basis, overall imports decreased by -$5.183 billion to $192.922 billion as crude oil imports plunged by -$2.202 billion. Crude oil imports are now $17.089 billion, a level not seen since 1994. Fuel oil imports also dropped by -$700 million. Cell phones and other related imports increased by $1.875 billion in a month, that's a record and imagine if those phones were manufactured in the United States.
- Industrial supplies and materials: -$4.609 billion
- Capital goods: -$0.796 billion
- Foods, feeds, and beverages: -$0.495 billion
- Automotive vehicles, parts, and engines: -$0.-745 billion
- Consumer goods: +$1.602 billion
- Other goods: -$0.140 billion
Below is the list of good export monthly changes, seasonally adjusted, by end use and on a Census accounting basis, declined by -$1.9 billion to $135.789 billion. Capital goods had a terrible month with a whopping -$2.299 billion monthly decrease. In civilian aircraft alone, there was a -$1.103 billion monthly decline in exports. On the other hand, the U.S. exported $583 million more in fuel oil for the month. Soybeans had a good month as exports increased by $664 million.
- Automotive vehicles, parts, and engines: -$0.49 billion
- Industrial supplies and materials: +$0.708 billion
- Foods, feeds, and beverages: +$0.274 billion
- Capital goods: -$2.299 billion
- Consumer goods: -$0.453 billion
- Other goods: +$0.345 billion
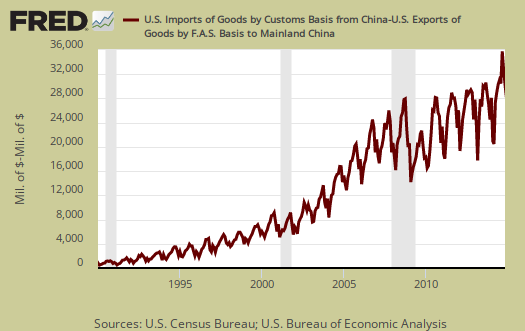
The China trade deficit is on track to hit another annual record and this month maintained it's highs with a not seasonally adjusted -$29.937 billion China trade deficit The China trade deficit alone was 56% of the not seasonally total goods deficit, on a Census accounting basis. The 2014 the trade deficit with China to date is -$314.332 billion. The below graph shows how highly cyclical the monthly trade deficit with China is. Country trade statistics are not seasonally adjusted, yet this time last year the 2013 cumulative China trade deficit was -$294.220 billion.
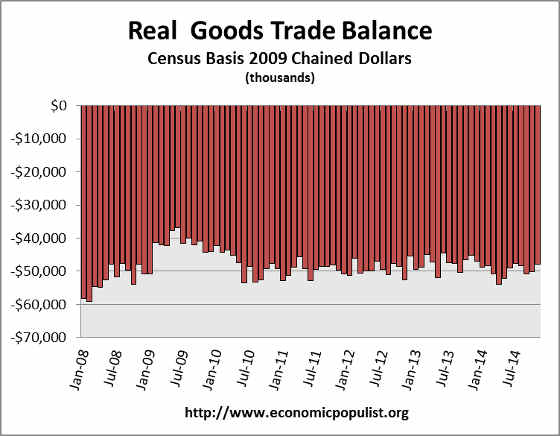
In real dollars, or adjusted for inflation, the goods trade deficit on a Census basis dropped -$2.2 billion to -$47.8 billion. Real valued trade figures are part of GDP.
Oil or petroleum trade deficit has just plummeted and is now a monthly -$11.437 billion. Petroleum related end use is now 20% of the monthly goods trade deficit by SITC classification. End use means the final use of the product and includes oil byproducts. For example, plastics are made up of petroleum, yet by their end use category, would be marked often as consumer goods. That's just astounding. A year ago this figure was more 33%. Not seasonally adjusted a barrel of crude was $82.95 and barrels for the month were at a low of 188,873.
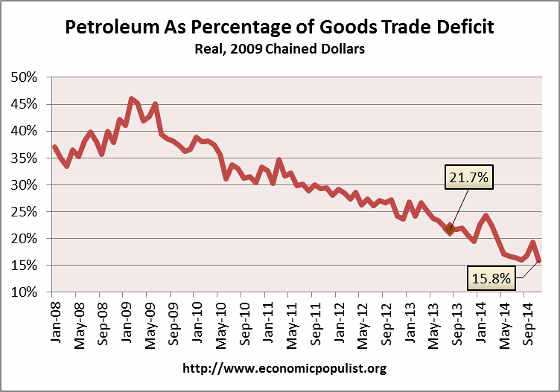
If we take the real valued end use of petroleum versus non-petroleum of the goods trade deficit, we see petroleum as a percentage of the trade deficit is plunging, which is great news. In November 2014 petroleum was only 15.8% of the real goods trade deficit. Real means the balance figures are adjusted prices using chained 2009 dollars so inflation is not in the mix. Below is a graph of petroleum end use deficit as a percentage of the goods trade balance and this breakdown is by the Census accounting method and in 2009 chained dollars. What we see is domestic production in energy has truly helped with the trade deficit, yet China imports more than take up the slack in continuing to send the U.S. economy abroad. U.S. domestic production is fracking which has it's own problems, most notably environment destruction.
Here are other trade deficit overviews, data unrevised.
Recent comments