
The November ISM Manufacturing Survey shows PMI increased 0.9 percentage points to 57.3%. This is another year high. Overall manufacturing looks strong with 15 of the 18 industries reporting growth. The employment index is at a high not seen since December 2012. New orders and production both increased.

The ISM manufacturing index is important due to the economic multiplier effect. While manufacturing is about an eighth of the economy, it is of scale and spawns all sorts of additional economic growth surrounding the sector. PMI is a composite index using five of the sub-indexes, new orders, production, employment, supplier deliveries and inventories, equally weighted.
This is a direct survey of manufacturers and every month ISM publishes survey responders' comments. Overall survey respondent comments were positive, with many implying demand has picked up. A few railed on the government negatively impacting their business due to shutdown games and other inefficiencies.
New orders increased 3.0 percentage points to 63.6%. This is really strong growth, the index is in the 60's, and increasing. Generally speaking, ISM sub-indexes in the 60's and staying there are truly positive signs for the manufacturing sector.

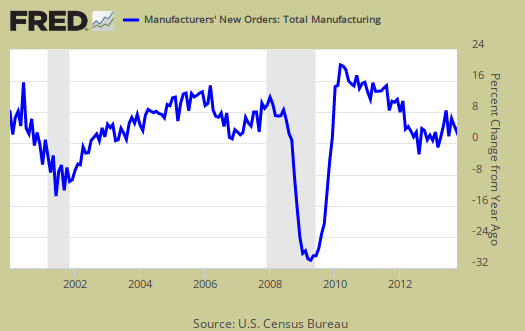
The Census reported October durable goods new orders decreased by -2.0%, where factory orders, or all of manufacturing data, will be out later this month, but note the one month lag from the ISM survey. The ISM claims the Census and their survey are consistent with each other. Below is a graph of manufacturing new orders percent change from one year ago (blue, scale on right), against ISM's manufacturing new orders index (maroon, scale on left) to the last release data available for the Census manufacturing statistics. Here we do see a consistent pattern between the two and this is what the ISM says is the growth mark:
A New Orders Index above 52.3 percent, over time, is generally consistent with an increase in the Census Bureau's series on manufacturing orders.
Below is the ISM table data, reprinted, for a quick view.
| ISM Manufacturing November 2013 | ||||||
|---|---|---|---|---|---|---|
| Index | November 2013 | October 2013 | % Change. | Direction | Rate of Change | Trend Months |
| PMI™ | 57.3 | 56.4 | +0.9 | Growing | Faster | 6 |
| New Orders | 63.6 | 60.6 | +3.0 | Growing | Faster | 6 |
| Production | 62.8 | 60.8 | +2.0 | Growing | Faster | 6 |
| Employment | 56.5 | 53.2 | +3.3 | Growing | Faster | 5 |
| Supplier Deliveries | 53.2 | 54.7 | -1.5 | Slowing | Slower | 5 |
| Inventories | 50.5 | 52.5 | -2.0 | Growing | Slower | 2 |
| Customers' Inventories | 45.0 | 47.0 | -2.0 | Too Low | Faster | 24 |
| Prices | 52.5 | 55.5 | -3.0 | Increasing | Slower | 4 |
| Backlog of Orders | 54.0 | 51.5 | +2.5 | Growing | Faster | 2 |
| Exports | 59.5 | 57.0 | +2.5 | Growing | Faster | 12 |
| Imports | 55.0 | 55.5 | -0.5 | Growing | Slower | 10 |
| OVERALL ECONOMY | Growing | Faster | 54 | |||
| Manufacturing Sector | Growing | Faster | 6 | |||
Production, which is the current we're makin' stuff now meter, increased 2.0 percentage points from last month and again numbers in the 60's indicates strong growth in production. Production usually follows incoming orders in the next month. The last time the production index was consistently in the 60's was March 2011.

ISM's manufacturing production index loosely correlates to the Federal Reserve's industrial production, but not at 50% as the inflection point, instead 51.2% to indicate growth. Below is a graph of the ISM manufacturing production index (left, maroon), centered around the inflection point, quarterly average, against the Fed's manufacturing industrial production index's quarterly change (scale right, blue). We can see there is a matching pattern to the two different reports on manufacturing production.

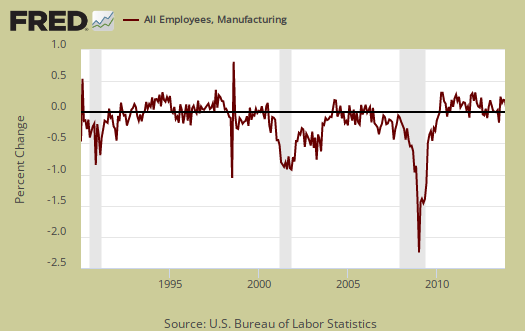
The manufacturing ISM employment index increased by 3.3 percentage points to 56.5%, which is growth, but simply way too slow considering the high production and new order indexes. The employment index is still in the 50's range. The neutral point for hiring vs. firing is 50.1%. Employment lags new orders and production, yet generally speaking it seems manufacturing employment just never gets off the ground and one must wonder if offshore outsourcing is impacting this index. Below are the BLS manufacturing non-farm payrolls (jobs) for the past decade on the left (maroon), graphed against the ISM manufacturing employment index on the right (blue). The BLS manufacturing payrolls is the monthly percentage change and the ISM manufacturing employment index is centered around it's inflection point of contraction and employment growth. This is just monthly change, manufacturing has lost approximately six million jobs over the graphed time period.
The inventories index declined by -2.0 percentage points to 50.5%, implying slower growth, real slow, since 50 is the inflection point for contraction. As the economy is stagnant, businesses adjust inventories in response, which in turn impacts GDP. In December 2009 inventories came in at 41.9% for comparison's sake. According to the ISM:
An Inventories Index greater than 42.7 percent, over time, is generally consistent with expansion in the Bureau of Economic Analysis' (BEA) figures on overall manufacturing inventories.

Supplier deliveries are how fast manufacturers can get their supplies. A value higher than 50 indicates slower delivery times, a value below 50 means the supply chain is speeding up. The index decreased by -1.5 percentage points to 53.2%, which still means a slower speed, but faster than the previous month and still slower than in the past. You may wonder why slow deliveries would boost up PMI and indicate stronger growth in manufacturing. The reason is slower vendor performance means there is probably higher demand for that supply and thus indicates increasing activity. Seems really round about way to indicate economic growth, but there ya have it.

Order backlogs gained 2.5 percentage points to 54.0% which is growth. Backlogs of orders increasing is generally good news. Less order backlogs would imply less production and less new employees to reduce backlogs, and we need about anything to get manufacturing hiring increasing.

Imports decreased -0.5 percent points to 55.0% and and are in expansion for the 10th month in a row. Imports are materials from other countries manufacturers use to make their products and high levels isn't too great for economies of scale in the U.S. We want to see U.S. manufacturers use other U.S. manufactured materials instead of imports as much as possible.

New orders destined for export, or for customers outside of the United States increase by 2.5 percentage point to 59.5% and has been in expansion for a year. This is the highest level in exports since February 2012 and is very good news. Seeing strong growth in exports from U.S. manufacturers, is great news from a trade perspective as well as implications on global economic demand picking up.

Prices declined by -3.0 percentage points to 52.5% which shows raw materials prices increased again, but at a slower rate. Prices are yo-yo, up and down, but this is the 4th month in a row for price increases in materials used by manufacturers.

Customer's inventories decreased by -2.0 percentage points to 45.0%. Below 50 means customer's inventories are considered by manufacturers to be too low. Customer inventories, not to be confused with manufacturer's inventories, are how much customers have on hand, and rates the level of inventories the organization's customers have. This sub-index is kind of useless as it always reports customer's inventories are too low. What is more interesting is the industries where it is claimed customer's inventories are too high. Those are: Petroleum & Coal Products; Chemical Products; and Electrical Equipment, Appliances & Components.

Here is the ISM industrial sector ordered list of growth and contraction. Chemical products finally showed some growth and machinery really blasted the government in the comments. Guess which political party this machinery survey responder is a member of:
Federal debt, deficit and inefficiency are causing a level of caution and uncertainty.
Of the 18 manufacturing industries, 15 are reporting growth in November in the following order: Plastics & Rubber Products; Textile Mills; Furniture & Related Products; Primary Metals; Food, Beverage & Tobacco Products; Paper Products; Printing & Related Support Activities; Petroleum & Coal Products; Miscellaneous Manufacturing; Electrical Equipment, Appliances & Components; Transportation Equipment; Chemical Products; Computer & Electronic Products; Nonmetallic Mineral Products; and Fabricated Metal Products. The three industries reporting contraction in November are: Apparel, Leather & Allied Products; Wood Products; and Machinery.
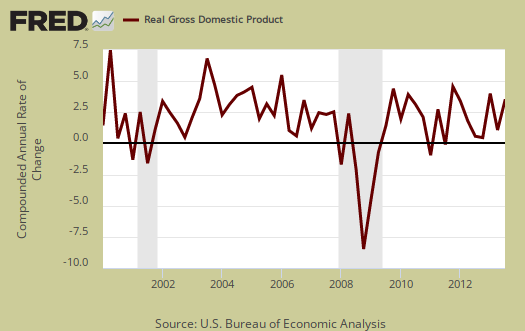
The ISM has a correlation formula to annualized real GDP, but they are now noting the past correlation, but note, PMI only has to be above 42.2% to indicate economic growth (right). Notice also that the PMI went to equal weighting in 2008. November alone gives a 4.7% 2013 annual real GDP correlation, which clearly is wishful thinking. If PMI for the year is annualized, the implication is 3.6% annual real GDP growth. The below graph plots real GDP, left scale, against PMI, right scale, GDP up to Q3 2013. One needs to look at the pattern of the two lines to get anything out of this by quarters graph. If they match, GDP goes up, PMI goes up, would imply some correlation. Of all of the ISM's correlations, this is the one which consistently is way off, yet this is a high in terms of economic growth implications. Next month we'll do a reality check on the accuracy of ISM's annual GDP correlation claims.
The ISM neutral point is 50, generally. Above is growth, below is contraction, There is some some variance in the individual indexes and their actual inflection points. For example, A manufacturing PMI above 42, over time, also indicates growth, even while manufacturing is in the dumpster. Here is last month's manufacturing ISM overview, unrevised. The ISM has much more data, tables, graphs and analysis on their website. For more graphs like the above, see St. Louis Federal Reserve Fred database and graphing system. PMI™ stands for purchasing manager's index. On ISM correlations to other indexes, when in dollars they normalized to 2000 values. The above graphs do not do that, so our graphs are much more rough than what the ISM reports these indices track.
Note: The ISM is seasonally adjusting some of these indexes and not others due to the criteria for seasonal adjustment. Those indexes not seasonally adjusted are: Inventories, Customers' Inventories, Prices, Backlog of Orders, New Export Orders and Imports.
Recent comments