
The July unemployment report is yet another disappointment, with not enough jobs to keep up with population growth. The jobs situation has been dismal for 43 months or over three and a half years. Yet those thinking Economic Armageddon Redux was suddenly upon us, literally crashing the BLS server to get the news, were sorely mistaken.
Earlier we reviewed the July 2011 BLS employment ratios. While not the Armageddon Wall Street was expecting, it's clear the job crisis has not dissipated. Both June and May new jobs numbers were revised upward, but not enough.
The change in total nonfarm payroll employment for May was revised from +25,000 to +53,000, and the change for June was revised from +18,000 to +46,000.
Let's drill down deeper into the numbers to show just how badly America needs good jobs.
There are 13,931,000 people officially unemployed, and if one takes the alternative measure of unemployment, it's 24.7 million.
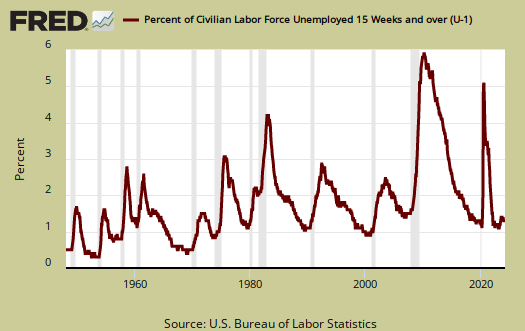
Below is a graph, courtesy of the Saint Louis Federal Reserve, for the unemployment rate of just those unemployed 15 weeks or longer. 58.5% of the people who are officially counted as unemployed have been so 15 weeks or longer. The number of people unemployed 15 weeks or longer as part of the civilian labor force is 5.3%. Compare this to the official 9.1% unemployment rate. This means that it takes most people who are unemployed almost 4 months or more to find a job...if they do.
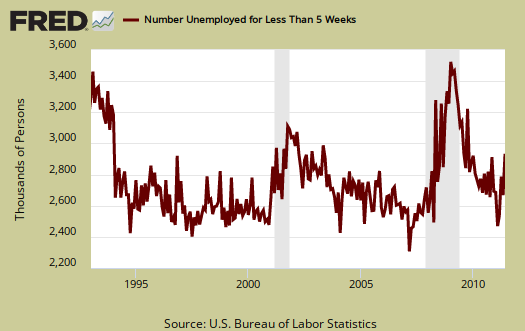
There are 2,689,000 people who are unemployed for less than 5 weeks in July, a decrease of -387,000. This is hard to believe, considering the increase in initial unemployment claims. People out of work 5 to 14 weeks increased 116,000 and 15 to 26 weeks unemployed rose by 129,000. Below is the graph of those unemployed for less than 5 weeks.
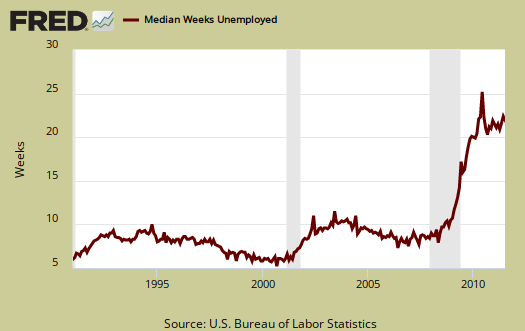
The below graph is the median time for being unemployed over the last 20 years. Look at the pathetic dramatic increase over time. This month the median duration, or half, to be out of work decreased -0.7 to 21.2 weeks. That means there is overall lost income by being out of work longer and we haven't even discussed how the new jobs are paying way less and most of the jobs being created are low paying jobs. The average time is much worse, and increase of 0.5 to 40.4 weeks. That's over 9 months as the average time to find a job. There is a vast deviation from the average and the median duration of unemployment. This means there are huge percentages of the unemployed who simply cannot get a break, being out of work for 2, 3 years and cannot land a damn job.
Most of the unemployed decrease occurred with those unemployed less than 5 weeks. Although last month there was a huge upswing. The long term unemployed decreased by -104,000 people in July.
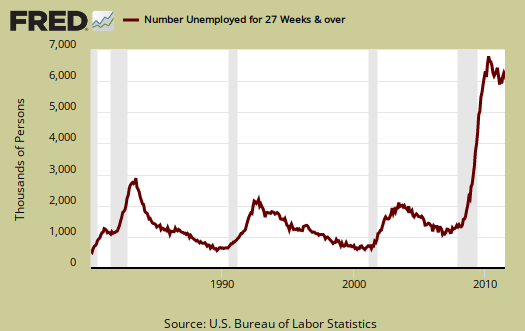
The problem with this number is we do not know the percentage of those who plain fell off the count and didn't get a job. We do know those being no longer counted as part of the labor force increased by 374,000 in one month. 44.4% of the official unemployed have been so for 27 weeks or longer. That's close to half of the official unemployed looking for work for over 6 months.
- Long term unemployed - 6.2 million
- Forced Part Time - 8.4 million
- Marginally attached to the labor force - 2.8 million
We do know the marginally attached, which are not counted as in the labor force, either looking for a job or have one, increase by 105,000 in July. Of the Marginally attached, 1,119,000 are discouraged, which is an increase of 137,000 from last month. Forced part-time decreased -156,000 this month, with those reporting the reason they could only find part-time increasing by 116,000. This is versus those getting their hours cut due to slow business.
The 2.8 million marginally attached are not counted in the official unemployment rate, but you can be guaranteed they do need a job. The BLS reports 6,575,000 people who are not counted in the labor force, actually want a job. That's huge! This number is direct from the CPS Survey. So, we have a solid statistic that 6.56 million people are not included in the official unemployed.
U6, defined as total unemployed, plus all persons marginally attached to the labor force, plus total employed part time for economic reasons, as a percent of the civilian labor force plus all persons marginally attached to the labor force, (table A.15), was 16.1%.
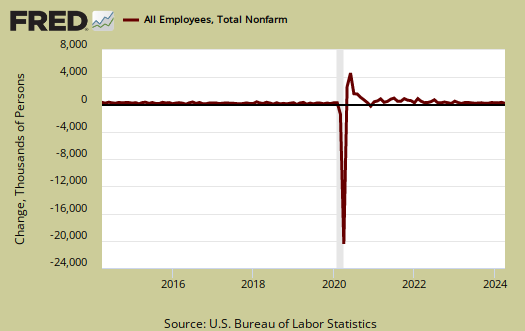
To even get back to pre-recession unemployment rate levels we need a good 424,000 jobs created each month. That's permanent jobs. Even if the U.S. created 400,000 permanent jobs each month, it would take over 17 months to recover the jobs lost since December 2007, the start of the great recession, or 6.79 million jobs. If one created 400,000 jobs per month, to get to the start of the great recession unemployment rate of 5%, or roughly 11 million jobs, it would take 27.5 months, or over 2 years to recover. If one takes the outliner jobs needed estimate, 19 million, at a 400,000 job creation rate per month, it would take 4 years for America to recover. Jobs are the crisis in America. Below is the seasonally adjusted monthly change in the number of payroll jobs in the U.S. See a lot of over 400,000 monthly increases in the past decade?
In looking over table B1 we can get a little more detail on what kind of jobs were created (and lost) on the permanent jobs front. Of the -37,000 government jobs lost, the BLS reports 23,000 of them where State government jobs and are directly attributable to Minnesota and their inane budget crisis.
- Financial: -4,000
- Information: -1,000
- Construction: +8,000
- Manufacturing: +24,000
- Durable: +23,000
- Mining & Logging: +10,000
- Health and Education: +38,000
- Education: +1,600
- Health: +36,700
- Leisure and Hospitality: +17,000
- Professional & Business Services: +34,000
- Temporary Help: +300
- Professional & technical services: +17,700
- Trade, Transportation, Utilities: +28,000
- Retail Trade: +25,900
- Government: -37,000
- State Government: -23,000
- Local Government: -12,200
Below you think computer jobs, technical jobs are roaring back, think again. Our government likes to count foreign guest workers in the job statistics. These are most often cheaper replacements, used to displace and labor arbitrage U.S. professionals. Of course the government refuses to differentiate between guest workers and U.S. citizens in occupational employment statistics as well as give an accurate tally of how many, or what type of guest worker are in the country at one time.
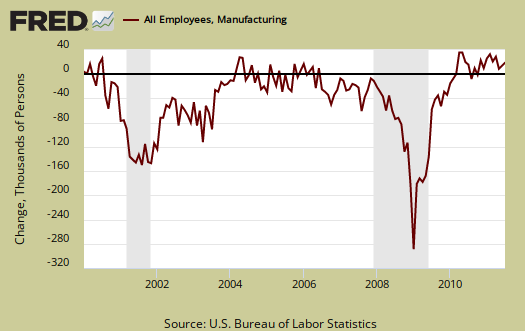
Below is the graph of the monthly change in manufacturing payroll jobs, seasonally adjusted, against the ISM Manufacturing Employment Index.
Bear in mind illegal workers and foreign guest workers are counted as employed Americans, which can distort occupational sectors, particularly the Engineering, I.T., Science and Technology ones. Below are the unemployment rates per occupational sector from table A-14, not seasonally adjusted. The overall unemployment rate, not seasonally adjusted is 9.3%. Because these rates are not seasonally adjusted, things like construction, which is highly dependent upon the seasons, appear artificially low.
- Financial: 9.4%
- Information: 7.6%
- Construction: 13.6%
- Manufacturing: 9.2%
- Transportation, Utilities: 7.8%
- Mining & Gas, Oil: 6.0%
- Health and Education: 5.9%
- Leisure and Hospitality: 10.9%
- Professional & Business Services: 9.4%
- Retail, Wholesale Trade: 9.4%
- "Other" Services: 8.6%
- Government: 6.4%
- Agricultural: 9.8%
- Self-employed, unpaid family: 6.4%
Probably the most horrific not seasonally adjusted unemployment rate is the 9.4% for Professional and Business Services unemployment rate. This occupation category implies a college degree. This particular area is fraught with foreign guest worker Visas, which distorts the real occupational unemployment rate. If an American is displaced by a foreign guest worker, then is forced to take a job at Walmart, that person is no longer categorized as a Chemical Engineering PhD out of work, but instead as a retail trade worker. So bear in mind all of these high occupational unemployment rates will miss people who took a lower paying job at Target in their statistics.
The above numbers are not seasonally adjusted so part of the agricultural and construction rates are due to the seasons, that said, construction unemployment has been decimated anyway you look at it. If one notices, the government unemployment rate is ticking up.
The average work week was again 34.3 hours, yet manufacturing average hours were 40.3 hours, meaning they make a little overtime. The BLS notes the flat line for worker bees on hours:
In July, the average workweek for production and nonsupervisory employees on private nonfarm payrolls was 33.6 hours for the sixth consecutive month.
Average earnings for the private sector (drum roll please), increased 10¢, $23.13/hr., a 0.4% increase in a month. Wages finally moved. The worker bees, or non-supervisory jobs average pay increased 8¢, or 0.4%, to $19.52/hr. This is great news, for years now we have seen very flat wages. For the year, wages have increased 2.3%.
Take a look at how many industry sections are below full time hours. Is a common practice among employers to keep workers part-time, in order to deny them full-time benefits. These numbers have improved to more full time per industry.

You probably also want to know the birth/death model. What is that? It's a statistical adjustment to compensate for new businesses and dead businesses who are not actually tallied by data reports. Those jobs created and died outside the statistical reporting time window due to lag. So, the BLS estimates how many jobs can be attributed to those firms which are not actually counted. This month's adjustment was -18,000 jobs. One cannot directly subtract the birth/deal model monthly numbers, because unemployment data is seasonally adjusted, yet the birth/death adjustment is not seasonally adjusted, get that? Anywho, jobs attributed to new and dead businesses are just an estimate in so many words. Not seasonally adjusted, payrolls subtracted -1,231,000 jobs. This is the reason why one cannot apply the birth/death model to seasonally adjusted data. Ok? You cannot mix them. If you want to take off the birth/death model you must do it to not seasonally adjusted data and then run the statistical algorithm to obtain the seasonally adjusted result. That said, seeing a raw tally of 1.23 million jobs lost in a month, well, one prays that seasonal adjustment model is still within the error boundaries.
We'll have more on the types of jobs created since the start of the Great Recession in an upcoming article. Stay tuned.
Recent comments