
Personal Income and Outlays for June 2010 was released today. While overall income is flat, wages and salaries are down.
Private wage and salary disbursements decreased $5.2 billion in June, in contrast to an increase of $19.2 billion in May. Goods-producing industries' payrolls decreased $8.9 billion, in contrast to an increase of $10.4 billion; manufacturing payrolls decreased $6.0 billion, in contrast to an increase
of $7.8 billion. Services-producing industries' payrolls increased $3.7 billion, compared with an increase of $8.8 billion. Government wage and salary disbursements decreased $0.6 billion, in contrast to an increase of $7.0 billion. The decline in the number of temporary workers for Census 2010 subtracted $3.4 billion at an annual rate from federal civilian payrolls in June; the hiring of additional temporary workers had added $5.7 billion at an annual rate in May.
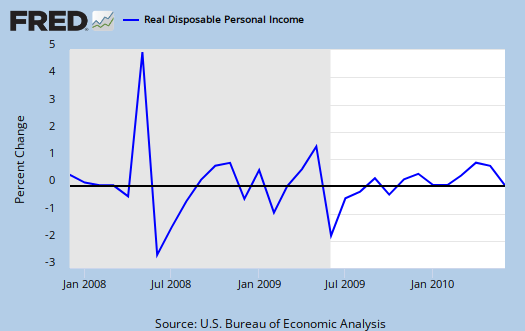
Personal income increased $3.0 billion, or less than 0.1 percent, and disposable personal income (DPI) increased $5.1 billion, or less than 0.1 percent, in June

Where did the increases come from? Personal current transfer receipts, $7.2 billion. That's unemployment insurance, social security and other benefits that imply they ain't workin'. Supplements to wages and salaries also increased, $1.9 billion.
Sole proprietors, otherwise known as small business, not incorporated, non-farm, also saw their income decline.
Proprietors' income decreased $4.4 billion in June, in contrast to an increase of $2.2 billion in May. Farm proprietors' income increased $0.2 billion, the same increase as in May. Nonfarm proprietors' income decreased $4.7 billion in June, in contrast to an increase of $2.0 billion in May.
Rental income of persons increased $1.8 billion in June, the same increase as in May. Personal income receipts on assets (personal interest income plus personal dividend income) increased $1.9 billion in June, compared with an increase of $4.1 billion in May. Personal current transfer receipts increased $7.2 billion, compared with an increase of $6.0 billion.
Contributions for government social insurance -- a subtraction in calculating personal income -- decreased $0.4 billion in June, in contrast to an increase of $3.8 billion in May.
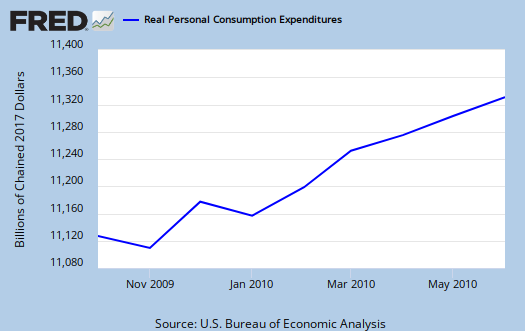
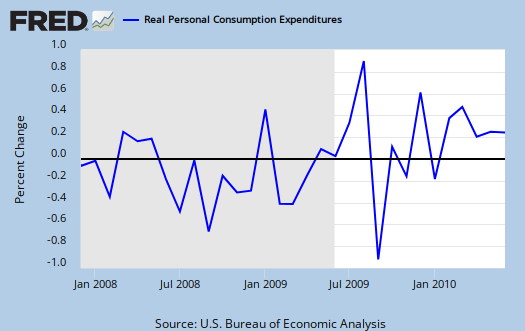
Below is PCE or consumer spending. Real PCE was flat, or +0.1% this month. PCE is a major component in GDP, taken on a quarterly, annualized average. So a flat PCE implies low growth in GDP.
Personal savings continues to increase, now at 6.4% of disposible personal income. If people have anything, they are sockin' it away. Good idea.

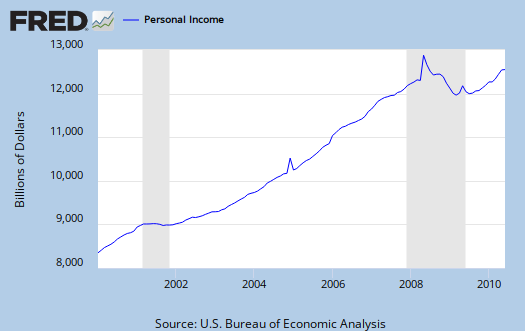
Transfer payments are payment from the government to individuals where no actual services (work) was performed. This includes social security, unemployment insurance, welfare, veterans benefits, Medicaid, Medicare and so on. Below is personal income minus transfer payments.
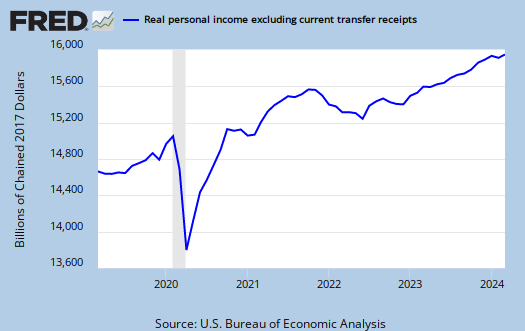
As you can see, personal income is nowhere near pre-recession or even early recession levels.
There were also a host of revisions.
Personal income was revised up for all 3 years: $18.2 billion, or 0.2 percent, for 2007; $152.3 billion, or 1.2 percent, for 2008; and $155.9 billion, or 1.3 percent, for 2009.
Disposable personal income (DPI) was revised up for all 3 years: $20.5 billion, or 0.2 percent, for 2007; $146.5 billion, or 1.4 percent, for 2008; and $117.6 billion, or 1.1 percent, for 2009.
Personal current taxes was revised down $2.2 billion for 2007, was revised up $5.8 billion for 2008, and was revised up $38.3 billion for 2009.
Personal outlays was revised down for all 3 years: $15.4 billion for 2007, $15.0 billion for 2008, and $79.1 billion for 2009. For all 3 years, downward revisions to PCE more than accounted for the revision to personal outlays.
The personal saving rate (personal saving as a percentage of DPI) was revised up for all 3 years: from 1.7 percent to 2.1 percent for 2007, from 2.7 percent to 4.1 percent for 2008, and from 4.2 percent to 5.9 percent for 2009.
Recent comments