
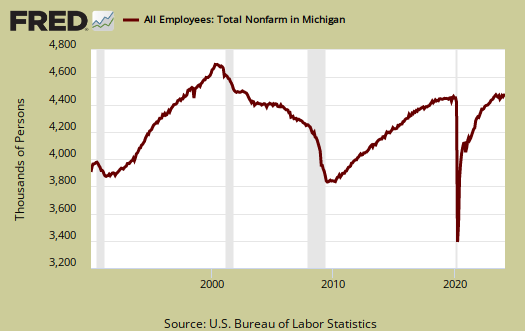
The BLS has released their Regional and State Unemployment Report for April 2011. Once again, Michigan cannot get a break. They just lost another -10,200 jobs. Overall the BLS reports there is little change in April from March's State employment figures.
Regional and state unemployment rates were generally little changed or slightly lower in April. Thirty-nine states recorded unemployment rate decreases, three states and the District of Columbia registered rate increases, and eight states had no rate change.
Look at this graph of Michigan jobs. They have lost two decades of job growth.
In April nonfarm payroll employment increased in 42 states and the District of Columbia and decreased in 8 states. The largest over-the-month increase in employment occurred in New York (+45,700), followed by Texas (+32,900), Pennsylvania (+23,700), Massachusetts (+19,500), and Florida (+14,900).
Nebraska experienced the largest over-the-month percentage increase in employment (+0.9 percent), followed by Kansas and Oklahoma (+0.8 percent each) and Louisiana and New Hampshire (+0.7 percent each). The largest over-the-month decrease in employment occurred in Michigan (-10,200), followed by Minnesota (-5,200), South Carolina (-3,800), Indiana (-2,500), and Vermont (-2,200).
Vermont experienced the largest over-the-month percentage decline in employment (-0.7 percent), followed by Michigan (-0.3 percent), and Idaho, Minnesota, and South Carolina (-0.2 percent each). Over the year, nonfarm employment increased in 46 states and the District of Columbia and decreased in 4 states. The largest over-the-year percentage increase occurred in North Dakota (+3.9 percent), followed by Alaska and Texas (+2.5 percent each) and Nebraska (+1.9 percent).
The four states reporting over-the-year percentage declines in employment were New Jersey (-0.2 percent), and Nevada, New Mexico, and South Dakota (less than -0.1 percent each).
Bear in mind, while some employment rates go down, that could be due to people dropping out of the labor force tallies, so a better indicator is the raw number of jobs, since we do not have labor participation rates for each State.
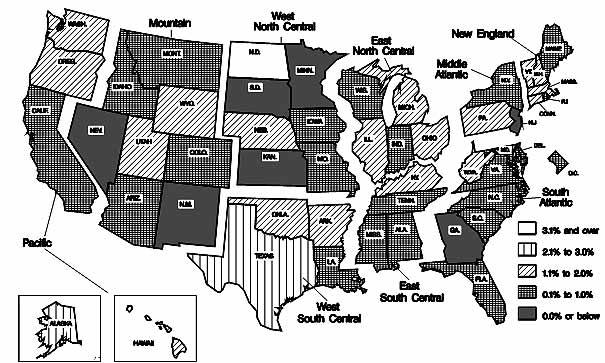
Below are the maps the BLS releases with their report. The first map shows the percentage change from March to April on the actual number of jobs in each state.
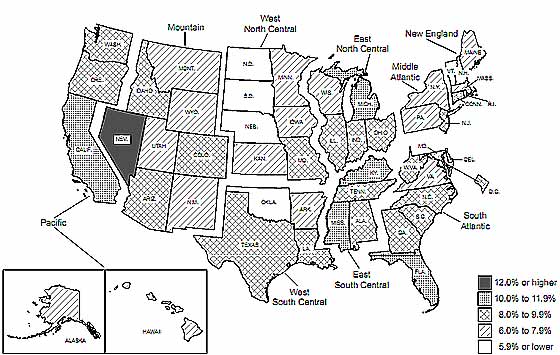
The next map shows the actual change in States' unemployment rates.
The BLS also issued another report, mass layoffs for April, with yet another 143,927 getting the axe in mass firings, that are tracked, for April.
Employers took 1,564 mass layoff actions in April involving 143,927 workers, seasonally adjusted, as measured by new filings for unemployment insurance benefits during the month, the U.S. Bureau of Labor Statistics reported today. Each mass layoff involved at least 50 workers from a single employer.
The number of mass layoff events in April increased by 278 from March, and the number of associated initial claims increased by 25,404. In April, 327 mass layoff events were reported in the manufacturing sector, seasonally adjusted, resulting in 35,022 initial claims; both figures increased over the month.
Recent comments