
January New Home Sales, released yesterday, were -- perversely -- good news!  Despite the perfectly correct mantra that new home sales continued to cliff-dive, and that, as my friend Bonddad said not once but Twice(!) yesterday, "We're Nowhere Near a Bottom in Housing" the simple fact is that the housing market is showing ample signs of the beginning of a transition.
Three months ago, in a post entitled Housing is Nowhere near Bottom ... BUT..." I laid out the case for the transition to come. Expansions typically end at a point where there has been an overproduction of durable items such as houses and cars. The ensuing recession ends and the next expansion begins only after that excess has been sopped up by a long and/or deep enough period of underproduction. Needless to say, there was wild overbuilding of houses in the first part of this decade.
Due to the massive overbuilding, the housing bubble is correcting via a market crash, which have been described by Russ Winter as typically consisting of two parts -- "guillotine" and "sandpaper" -- by which he means that there is an initial near vertical decline (the guillotine) followed by a long, grinding slow further decline (the sandpaper). Here's an example (Japan's stock market crash) pulled from his blog:
In the case of the housing market crash, the change from "guillotine" to "sandpaper" would be seen in a decline in months' supply of houses for sale towards the inflection point between advancing and declining house prices at about 7 months' supply, as sales started to outstrip new house starts and existing homes being offered for sale. In order to accomplish that, you would first need to see that new home building has declined to a level where sales exceed new starts. You would also want to see existing home sales increasing on a year-over-year basis. In other words, the volume of new home starts would transition from guillotine to sandpaper first, well before prices themselves would begin the transition.
Three months ago I noted that all of those conditions had either started or appeared to be on the cusp of starting. So what do they look like now?
In the context of transitioning from "guillotine" to "sandpaper", January's 309.000 new home sales continue to the trend, since mid-2005, of declining by about 300.000 sales a year. Here's the graph (courtesy The Mess that Greenspan Made):
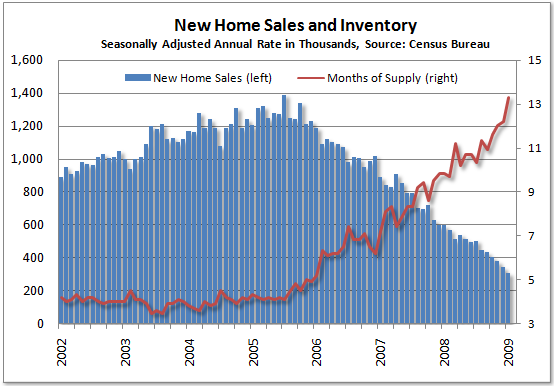
If this trend continues, then within 12-16 months, there will be ZERO new home sales! In other words, almost certainly either this year or early next year new home sales either will have bottomed, or be within 10% of their bottom. While months' supply of new houses is at a record 13.3 months, this is misleading because of the ultra-low monthly base on which it is based. To clarify, here is a graph (courtesy Calculated Risk) of new home inventories since 2002:
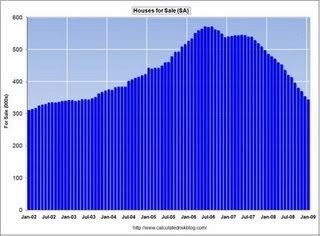
Note that the supply of new homes, at 347,000, is almost equal to the pre-blowoff 2002 number. Note also that new home inventory for the last 18 months has been declining, on average, 10,000 houses per month.
We can calculate another way. There are approximately 300.000.000 Americans, and about 112.500,000 households. While over the long term this has changed, for a reasonable analysis, we can take this ratio as a constant. Population has been increasing at about 1% a year. This means that about 1,125.000 new housing units have to be produced each year to keep up with additional household formation. About 1/3 of this is apartment stock, leaving about 750,000 new houses a year as a "neutral" figure. Figure in addition to that, that a certain percentage of old or destroyed housing stock must be replaced, probably at about 200,000 units a year if the stock typically lasts about 100 years or so. 2/3 of that is about 133,000. A reasonable estimate of total new home sales each year to keep up with population would be about 887,000 a year, or 74,000 a month. A supply of 347,000 new homes is about 4.6 months' supply. Note that earlier in this decade, when prices were booming, typically there was about 3 months supply on the market. 4.6 months' supply of a "neutral" number is not too much higher than the 3 months' supply that would constitute a "tight" market.
In other words, if and when new home sales bottom in the next 12-15 months, the market will again be quite tight.
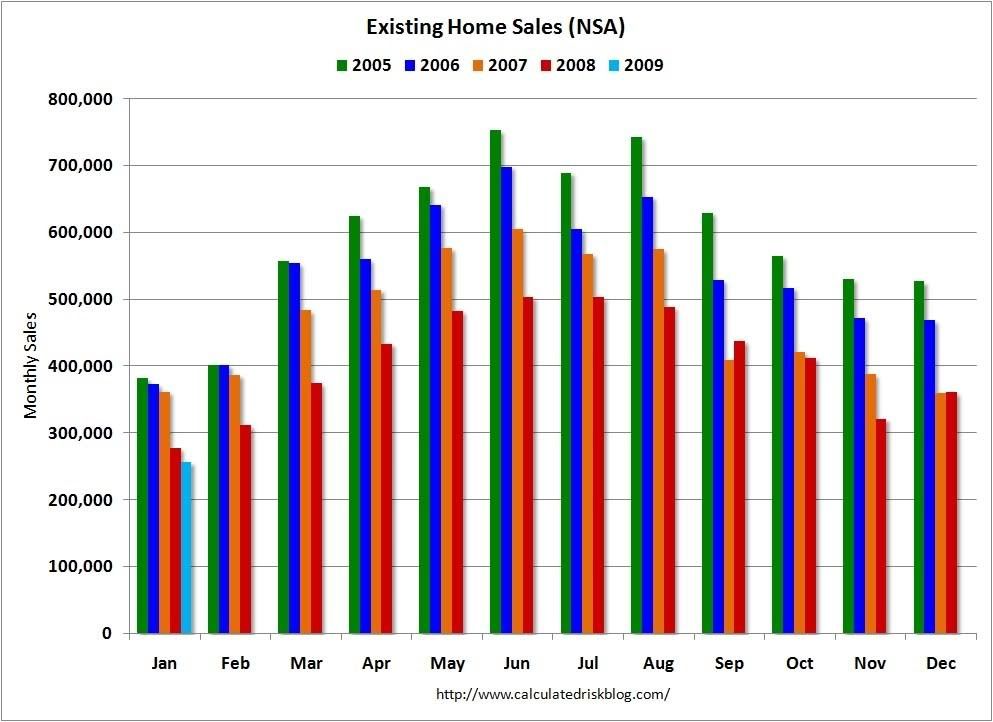
If new home sales show that the transition from guillotine to sandpaper is getting ever nearer, existing home sales are even more clear. For example, for 5 of the 6 months beginning in September 2008, existing home sales have surpassed, or at least come close to the previous years' volume of sales:
Additionally, months' supply of existing homes for the last two months have been ~9.5 months, the lowest since mid-2007:
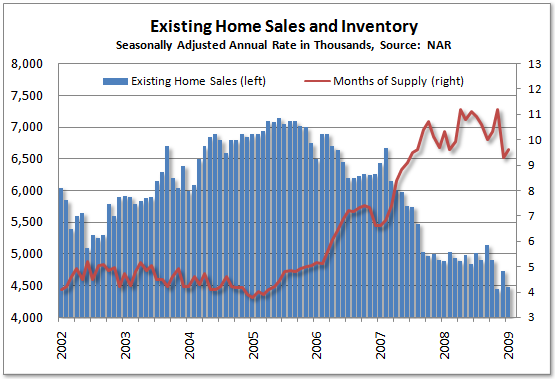
I concluded my post three months ago by suggesting that we might be at the beginning of the transition from the guillotine to sandpaper phases of the housing market, with volume transitioning first, before price. The continuing near-halt of new home sales, together with the decline in inventories and in months' supply of existing homes, makes me more confident of that view.
On an important aside, note that while new home sales have fallen by over 75%, existing home sales have only fallen about 45%. And new home sales continue to collapse year over year while existing home sales show signs of stabilization. An important reason can be found in this graph, also courtesy of Tim Iacono:
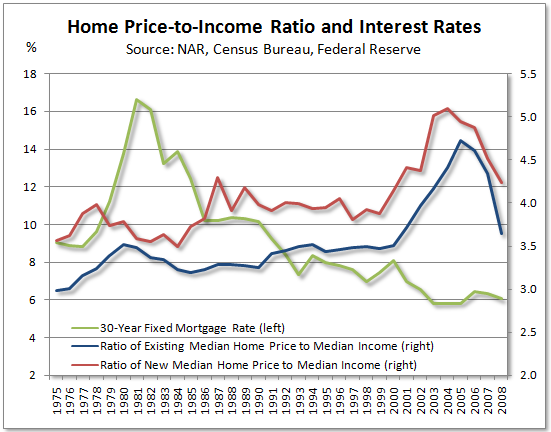
Note that existing home prices have fallen almost all the way back to their long-term average ratio of median income, while new home prices are still quite elevated. Simply put, for most buyers, existing homes are compelling bargains as compared to new homes, and are out-competing them.
A bottom in housing volume (regardless of prices) is important. I have pointed out in a number of previous posts how real private residential investment turning up -- or at least declines much slower than overall GDP -- is one of the earliest signs of an end to a recession and the beginning of economic expansion. We could see that (relative) upward turn in residential investment as early as later this year. If you don't want to take my word for the importance of such a turn, then how about Prof. Paul Krugman from a couple of weeks ago:
[M]y general view is that this isn’t your father’s recession; it’s your grandfather’s recession. And the experience with pre-WWII recessions may be a useful guide. I’m not just talking about the Great Depression; some earlier experiences may in some ways be equally or more relevant.
....
[T]he seeds of eventual recovery are already being planted.Consider housing starts, which have fallen to their lowest level in 50 years. That’s bad news for the near term. It means that spending on construction will fall even more. But it also means that the supply of houses is lagging behind population growth, which will eventually prompt a housing revival.
Or consider the plunge in auto sales. Again, that’s bad news for the near term. But at current sales rates, as the finance blog Calculated Risk points out, it would take about 27 years to replace the existing stock of vehicles. Most cars will be junked long before that, either because they’ve worn out or because they’ve become obsolete, so we’re building up a pent-up demand for cars.The same story can be told for durable goods and assets throughout the economy: given time, the current slump will end itself, the way slumps did in the 19th century. As I said, this may be your great-great-grandfather’s recession. But recovery may be a long time coming.
To sum up: When you go SPLAT!, you've reached the bottom of the cliff.
Comments
Thanks for the analysis
This blog is a real contribution to the debate. I think you are right on. We surely need more thoughtful non=panicked input into the national conversation.
There is a flaw in the
There is a flaw in the calculations in that houses destroyed for what ever reason is in the range of 600-700,000 anualy
Do you have a link?
For the number of houses destroyed each year?
Thanks.