
The Federal Reserve Industrial Production & Capacity Utilization report shows a -1.0% decline in industrial production for October and September was revised down to 0.8% growth. Manufacturing alone grew by 0.2%, but utilities dropped by -0.7% after last month's large gain. Mining also decreased by almost a percentage point, -0.9%. The G.17 industrial production statistical release is also known as output for factories and mines. This is the largest industrial production monthly gain since September 2012.
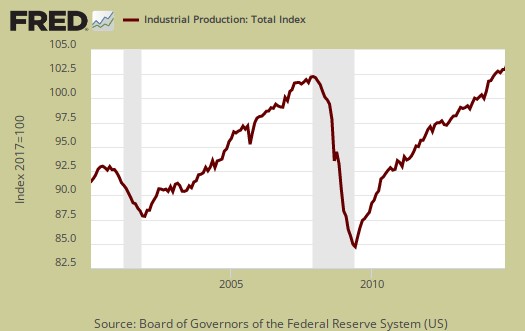
Total industrial production has now increased 4.0% from a year ago. Currently industrial production is 4.9 percentage points above the 2007 average. Below is graph of overall industrial production's percent change from a year ago.

Here are the major industry groups industrial production percentage changes from a year ago. We can see the sudden jump up from utilities this month isn't a trend at all.
- Manufacturing: +3.4%
- Mining: +9.9%
- Utilities: -1.3%
Manufacturing output is just 0.6 points above it's 2007 average. This is an enormous amount of time just to reach 2007 levels. This month's report has some foreboding news for motor vehicles and parts. This sector has a multiplier effect so the below 400,000 unit decline is one piece of bad news past the percentages:
These gains were partially offset by declines of more than 1 percent in the indexes for nonmetallic mineral products and for motor vehicles and parts. The decline in motor vehicles and parts resulted from a decrease in vehicle assemblies, which fell 400,000 units to an annual rate of 11.1 million.

Within manufacturing, durable goods increased 0.1% for the month on machinery which increased 1.3% and in spite of the almost percentage point downturn in motor vehicles & parts. Other groups also showed good monthly gains:
wood products, computers and electronic products, and furniture and related products all recorded gains of more than 1/2 percent.

Nondurable goods manufacturing increased by 0.3% for the month and increases were across the board except for paper products which is undergoing a technological shift. The below graph is fairly depressing as nondurable goods hasn't recovered almost at all from the great recession.

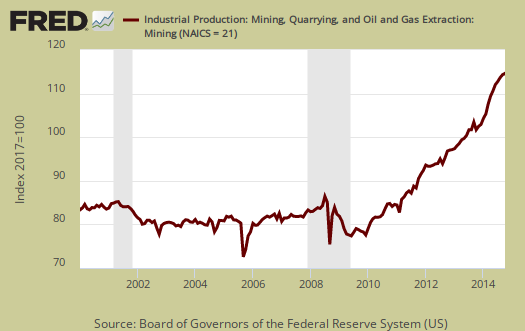
Mining with U.S. oil & gas production has been growing, although considering the latest free fall in oil prices we're not sure how long this will go on. Mining showed a -0.9% monthly decrease and for the year has increased 9.9%. Mining includes gas and electricity production.
Utilities are volatile due to weather and why the below graph shows the wild swings. October showed a -0.7% decline but we can expect a blow out next month due to the latest arctic blast over much of the country.

There are two reporting methodologies in the industrial production statistical release, market groups and industry groups. Market groups is output bundled together by market categories, such as business equipment or consumer goods.
In October, declines in the indexes for consumer goods and materials were the largest contributors to the decrease in total industrial production; the indexes for defense and space equipment and for business supplies also recorded declines. Gains in the production of business equipment and construction supplies offset some of the losses. The output of consumer goods moved down 0.2 percent, with decreases of more than 1 percent for automotive products and paper products and with a smaller decline for energy goods. The output of materials decreased 0.2 percent, as a decline in the production of energy materials was only partially offset by small gains in the indexes for durable and nondurable materials. By contrast, the production of business equipment moved up 0.6 percent, with increases in the indexes for information processing equipment and for industrial and other equipment; the output of business equipment was 4.6 percent above its level of a year earlier.
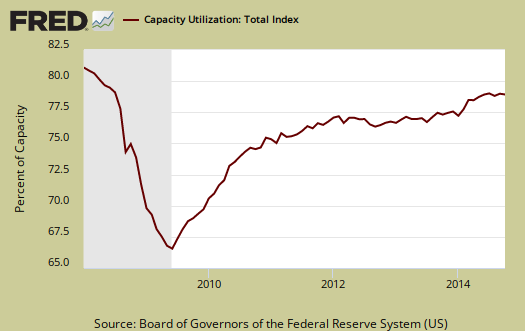
Capacity utilization, or of raw capacity, how much is being used, for total industry is 78.9%, a -0.3 percentage point monthly decrease. How much plants are utilized is now 1.2 percentage points below the average from 1972 to 2013. Capacity utilization has increased 0.7 percentage points from a year ago. Manufacturing capacity utilization is 77.2% and is 0.9 percentage points higher than a year ago. Mining capacity utilization is 88.3% and is up 0.9 percentage points from a year ago. Utilities use of it's capacity is 78.5% and this -1.5 percentage points from a year ago. Manufacturing is still 1.5 points below the long term average (1972-2013).
Capacity utilization is how much can we make vs. how much are we currently using, of what capacity is available now, or output rate. Capacity utilization is also called the operating rate. Capacity utilization is industrial production divided by raw capacity.
Capacity growth is raw capacity and not to be confused what what is being utilized. Instead, this is the actual growth or potential to produce. Capacity is the overall level of plants, production facilities, and ability to make stuff, that we currently have in the United States. Capacity growth overall has increased 3.0 percentage points from a year ago. Below is the capacity growth increase from a year ago of the subcategories which make up industrial production.
- Manufacturing: +2.2%
- Mining: +8.7%
- Utilities: +1.0%
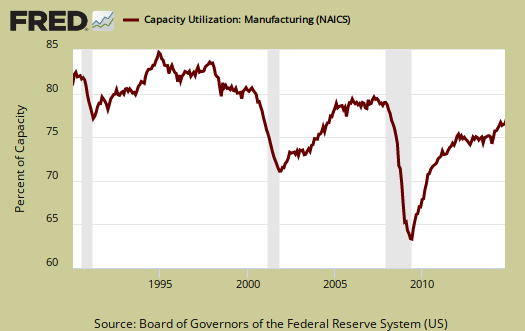
Below is the Manufacturing capacity utilization graph, normalized to 2007 raw capacity levels, going back to the 1990's. Here is where offshore outsourcing really shows up. Pay particular attention to the 2001-2003 as manufacturing had a mass exodus to China after passage of the bad trade deal in 2000.
Here are our previous overviews, only graphs revised. The Federal Reserve releases detailed tables for more data, metrics not mentioned in this overview.
Falling Wages at Factories Squeeze the Middle Class
http://www.nytimes.com/2014/11/21/business/falling-wages-at-factories-sq...