
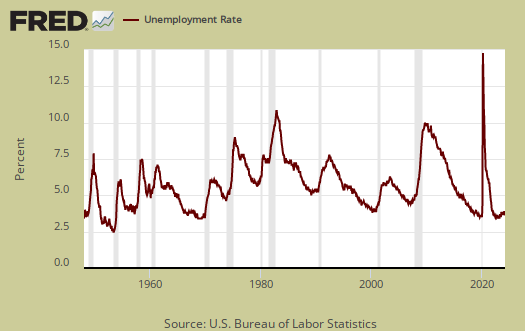
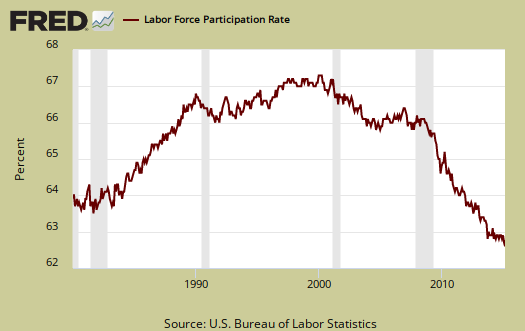
The March unemployment rate remained the same, yet once again the BLS survey showed another huge increase in those not considered part of the labor force anymore and as a result the figure hit a record 93.175 million high. The official unemployment rate is 5.5%. The labor participation rate is also 62.7% and remains at 37 year record lows. From a year ago, the number of people considered not in the labor force has increased by over two million.
This article overviews and graphs the statistics from the Employment report Household Survey also known as CPS, or current population survey. The CPS survey tells us about people employed, not employed, looking for work and not counted at all. The household survey has large swings on a monthly basis as well as a large margin of sampling error. The CPS has severe limitations, yet, it is our only real insight into what the overall population are doing for work.
Those employed grew by only 34,000 this month. This is within the margin of error of the survey. From a year ago, the employed has increased by 2.535 million. This is beyond what is needed to keep up with increased population growth.

Those unemployed decreased by -130,000 to stand at 8,575,000. From a year ago the unemployed has decreased by -1.81 million. Below is the month change in unemployed and as we can see, this number normally swings wildly on a month to month basis.

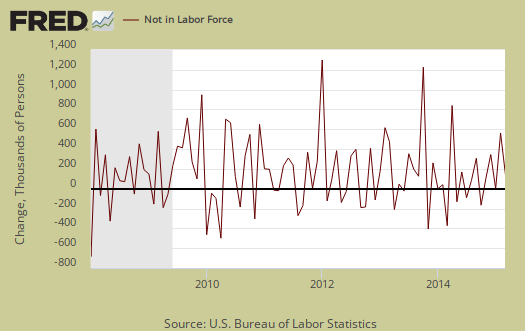
Those not in the labor force increased by 277,000 persons and to bet 93,175,000. The below graph is the monthly change of the not in the labor force ranks. Those not in the labor force has increased by 2,098,000 in the past year.
The labor participation rate is at 62.7%, a -0.1 change from last month. Those aged 16 and over either working or looking for work is still at record lows, as shown in the below graph.
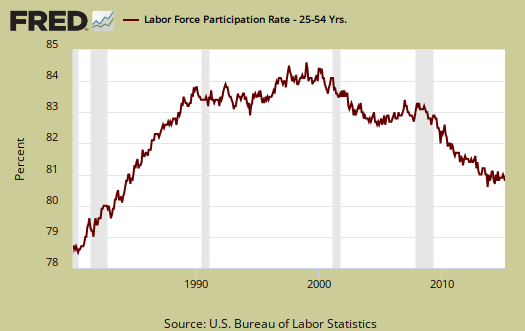
The low labor participation rate is not all baby boomers and people entering into retirement. Below is a graph of the labor participation rate for those between the ages of 25 to 54. These are the prime working years, so one cannot blame retirement and college on the declining participation rate. The 25 to 54 age bracket labor participation rates have not been this low since the 1980's recession and the rate stands at 80.9%.
The civilian labor force, which consists of the employed and the officially unemployed, increased by 181 thousand this month. The civilian labor force has grown by 2.822,000 over the past year. New workers enter the labor force every day from increased population inside the United States and immigration, both legal and illegal.

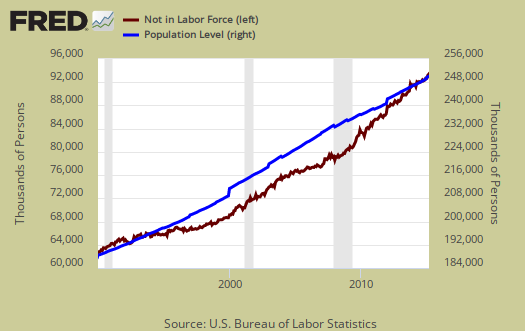
In spite of wild statistical swings, those not in the labor force often grows faster than the population which has the potential to work. Below is a graph of those not in the labor force, (maroon, scale on the left), against the noninstitutional civilian population (blue, scale on the right). Notice how those not in the labor force crosses the noninstitutional civilian population in growth and the accelerated growth started happening right in 2008. This increase cannot be explained by retiring baby boomers alone.
Below is a graph of the civilian labor force, or the official employed plus unemployed, in maroon, scale on left, against those not in the labor force, in blue, scale on right. Notice how those not in the labor force as a trend exceeded those considered employed and unemployed starting around mid 2009. What we have seen is a never ending growing segment of the population that is considered neither employed or unemployed, i.e. not in the labor force, increasing, above the trend line of those who would be naturally dropping out, such as the retired and those in school. Not in the labor force figures do include retirees and the size of the population greater than age 65 has grown.

Those considered employed as a ratio to the total Civilian noninstitutional population now stands at 59.3%, which is more no change for the last three months. For the interested, there is a relationship between the employment-population ratio and the labor participation rate (LPR): employment-population ratio = LPR * (1 - unemployment rate).

Part-time for economic reasons increased. There are millions of people who need full-time jobs with benefits who simply cannot get them and only obtain part-time work. Those forced into part time work is now 6,705,000, an increase of 70,000 from last month. The reason for the increase is not a good economic sign, slack work conditions discussed below.

There are two categories of those working part-time hours. Those who could only get part-time jobs and those working who got their hours cut due to businesses not having enough work for them. The number of people who could only get part-time work declined slightly by -89 thousand to 2,337,000 as shown below.

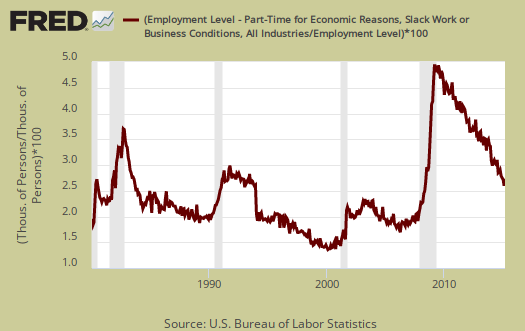
People can also be stuck with part-time hours due to slack working conditions. People who got their hours cut dramatically increased by 222,000 and stands at 4,069,000. Below is a graph of forced into part-time work because they got their hours cut, as a percentage of the total employed. This is a recession economic indicator, see how the line slope matches strongly the graph gray recession bars in the below graph.
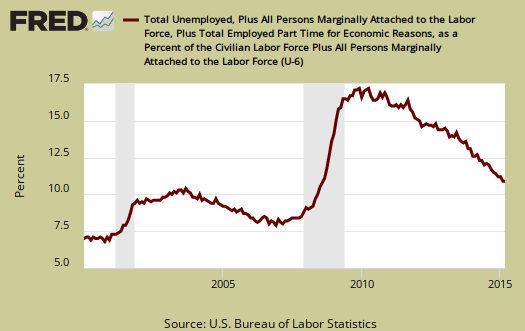
U-6 is a broader measure of unemployment and includes the official unemployed, people working part-time hours because that's all they can get and a subgroup not counted in the labor force but are available for work and looked in the last 12 months. The U-6 rate still leaves out some people wanting a job who are not considered part of the labor force. U-6 now stands at 10.9%.
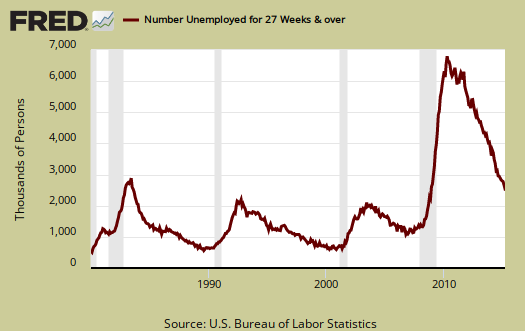
The long term unemployed, or those unemployed for 27 weeks and over, dropped by -146,000 to stand at 2,563,000 people. From a year ago the long term unemployed ranks have decreased by -30.4%, but this does not mean at all those folk found work. Some must be dropping out of the labor force, giving up as evidenced by the record high not in the labor force figures.
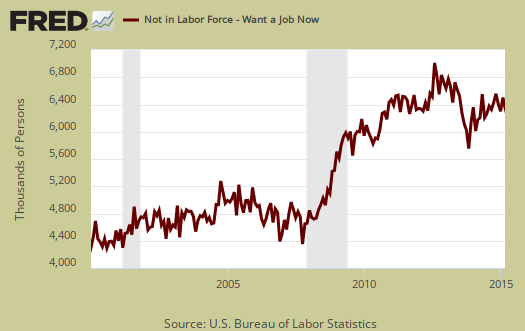
Our favorite statistic from the CPS survey is how many people who are considered not in the labor force, report they want a job now. It is a direct survey question from the CPS. The survey asks people who are not being counted in the unemployment statistics and official unemployment rate if they want a job. The number who answer yes currently stands at 6,369,000, a very large number of people. Those who are not counted yet report they want a job includes the discouraged workers and marginally attached and is seasonally adjusted. This figure has increased by 7.7% from a year ago and also increased 180,000 from last month. This figure should drop along with the unemployment rate as these people rejoin the job hunt if the labor situation was really great, so something is very wrong for workers and job seekers with this kind of annual gain.
There is much more to the household survey yet the real news is the record breaking numbers of those not in the labor force. There is no way these figures could swell so much on just the baby boomers retiring. Here are our past overviews CPS unemployment statistics, only graphs revised.
So we're still at square one
Interesting -- So currently there are 6.3 million people not counted as "unemployed" who want a job and another 8.5 million currently counted as officially "unemployed" who also want a job -- which totals almost 15 million -- about the same number we had at the peak of unemployment in 2009.
So all the net new jobs that were created since then may have only kept up with population growth, and none of the 8.7 million jobs lost during the Great Recession were never really "recovered" (as the media likes to put it).
Excellent analysis. Your
Excellent analysis. Your last (favorite) graph is very insightful.