
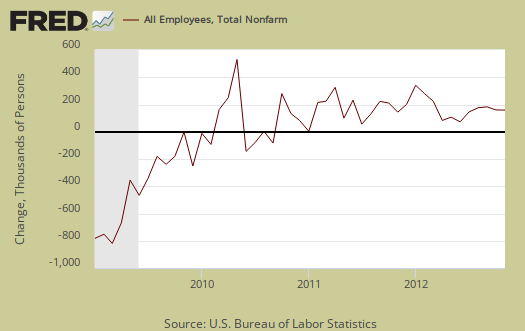
The BLS unemployment report shows total nonfarm payroll jobs gained were 146,000 for November 2012. But there is hidden bad news in this report. October payroll gains were revised down, from 171,000 to 138,000. September payrolls were also revised down from 148,000 to 132,000. The below graph shows the monthly change in nonfarm payrolls employment.
The BLS employment report is actually two separate surveys and we overviewed the current population survey in this post. There is even more bad news in that most jobs gained are unskilled, low paying jobs.
The start of the great recession was declared by the NBER to be December 2007. The United States is now down -4.13 million jobs from December 2007, 4 years and 11 months ago. This is just ridiculous on how long the ongoing employment crisis has been.
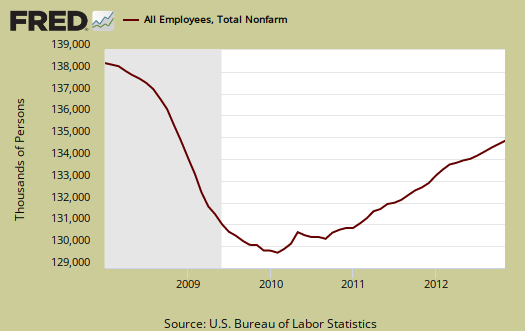
The below graph is a running tally of how many official jobs are permanently lost, from the establishment survey since Decemember 2007. Amazing isn't it considering the time period of the below graph.

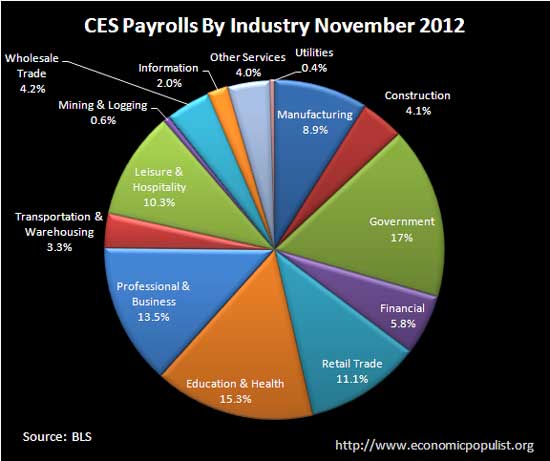
We broke down the CES by industry to see what kind of percentage changes we have on the share of total number of payroll jobs from 2008 until now. Below is the percentage breakdown of jobs by industry for January 2008.
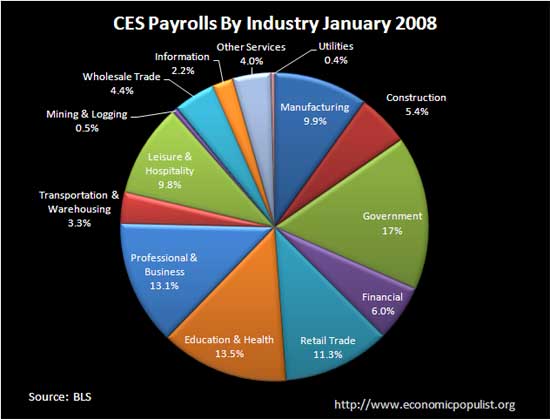
We expected to see construction jobs shrink relative to total payrolls and it did, by 1.3 percentage points. Notice the culprit of the recession, the financial sector, only shrank 0.2 percentage points as it's share of payroll jobs. Manufacturing, of which the auto industry is a part, has contracted an entire percentage point as share of total jobs. Not all of this is job loss, productivity increases and time marches on and some jobs become obsolete. These two pie charts make it painfully obvious our manufacturing sector continues to erode and the only real growth field is in health care. Not exactly a demonstration of America being a titan of industry.
From November of 2011, the United States has gained 1.889 million payroll jobs. In the year previous, the U.S. had gained 1,737,000 jobs. This tells us jobs have been growing at pretty much at the same pace for the last two years and it's simply not fast enough to employ the 12 million official unemployed, never mind the estimated 18-23 million Americans who really need a good job.
Just to keep up with population growth, we need at least 100,000 jobs per month or 1.2 million a year and this estimate assumes the current low labor participation rates. As we can see we're really breaking even on jobs at this point, almost five years since the start of the recession.
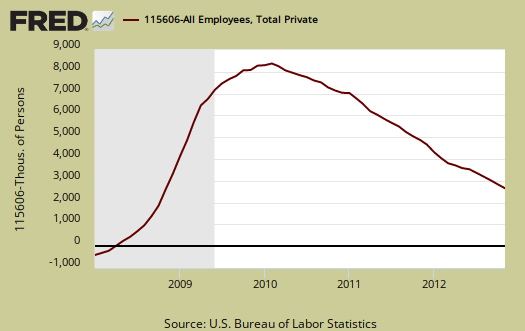
Private Sector jobs, or jobs not from the government gained 147,000, yet are still down -3,716 million jobs from December 2007. Good producing jobs, which usually have higher paying ones, declined by -22 thousand for November. Service producing jobs, which includes our fast food and big box mart workers, increased by 169,000. Merry Christmas. Below is a graph of just the private sector payroll losses since December 2007.
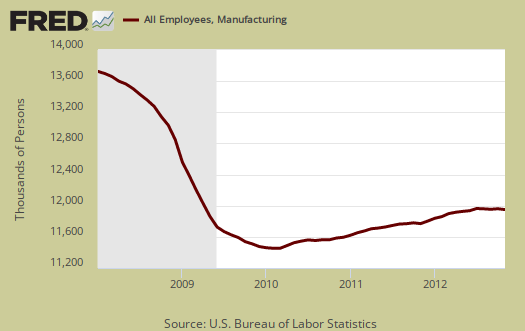
Manufacturing alone has lost -1.769 million jobs since January 2008. This month manufacturing lost -7,000 jobs. Most interesting if one thinks of the loss of Hostess, durable goods manufacturing added 18,000 jobs yet nondurable lost -22,000. Food manufacturing lost -12,000 and then chemicals lost -9,000.
Much is proclaimed about the auto industry recovery. Below is the graph of autos, trucks & parts manufacturing jobs. We can see payrolls have been eroding for some time, and have not recovered from even the recession. This month the auto & parts manufacturing gained 9,700 jobs but since December 2007, the auto manufacturing industry is still down -170,200 jobs.

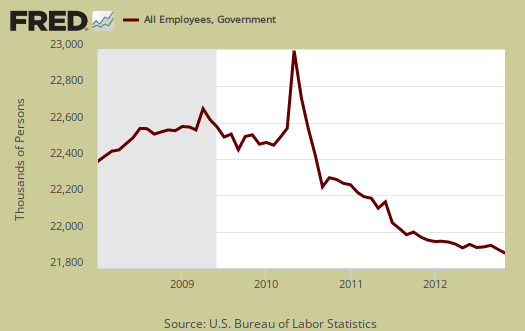
Government lost -1,000 jobs for November with -4,000 from the U.S. postal service alone. Government, especially at the state and local level has been hemorrhaging jobs. Since January 2008, all government payrolls are down -414,000 jobs.
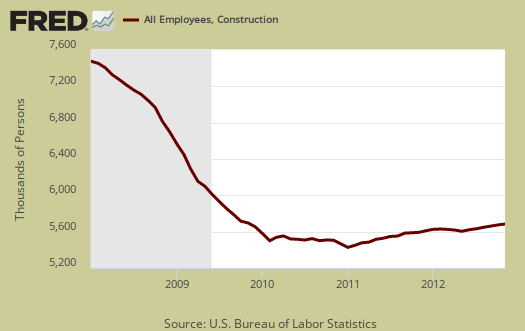
Construction has just been hammered due to the housing bubble collapse as well as the recession. This month construction lost -20,000 jobs and from the beginning of the 2008 jobs in the construction field are down -1.967 million jobs.
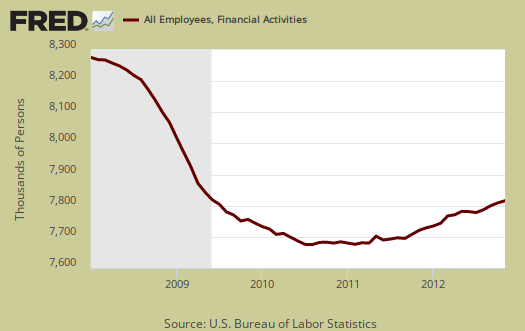
Financial activities payrolls are now down -454,000 jobs since the start of the recession. This month the financial sector gained 1,000 jobs.
Retail trade, which are your retail sales outlets like big box marts, direct mailing and anything retailing merchandise, is down -663 thousand jobs since the start of 2008 and this month gained 52.6 thousand jobs. These were mainly low paying jobs and for the past three months retail trade employment has increased by 140 thousand. The retail trade jobs which increased were clothing stores by 33,000, general merchandise stores, which gained 10,000 jobs and electronics and appliance stores added 9,000 jobs.

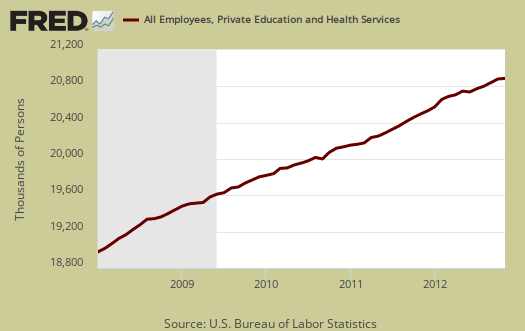
Education and health services has consistently been increasing and this month was no exception 18,000 additional jobs and of those jobs 20 thousand were in health care while -3.7 thousand education jobs were lost. A total of 1.847 million jobs have been gained in education & health services since the start of 2008.
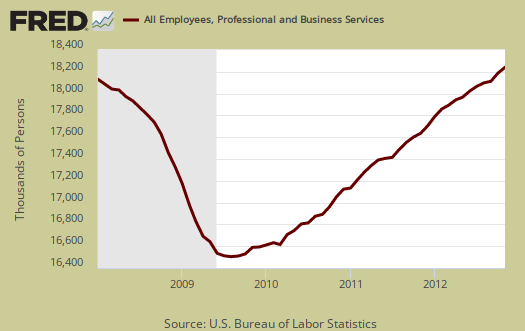
Professional & Business services contains management, career professionals, science & technical, administrative and support and finally waste services. This industry sector has gained a whopping 3 thousand jobs since the start of the great recession and this month added 43,000 jobs, with 18 thousand of those jobs being temporary. Waste management, part of this group gained 23.3 thousand jobs.
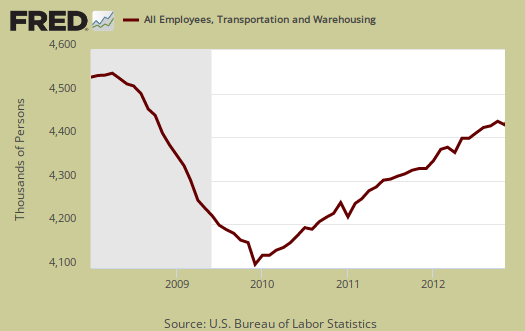
Transportation and warehousing also has still not recovered their jobs and are down -144 thousand since January 2008. This sector has been losing jobs for recent months with November's gain being 3,500. These are services for moving of people as well as cargo and also storage.
Wholesale trade added 13,000 jobs and information gained 12,000 jobs on gains in film and sound, which added 14.6 thousand jobs.
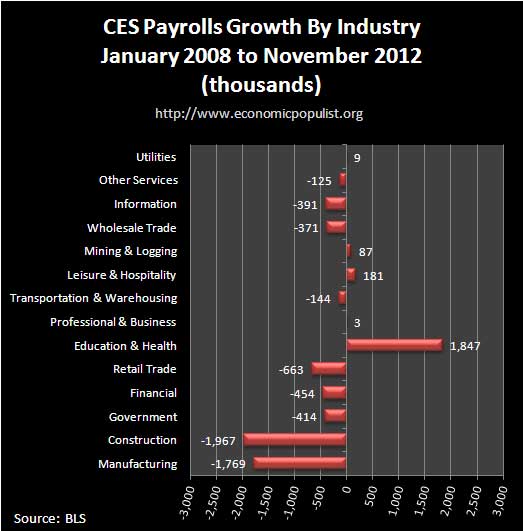
Below is a bar chart showing the payroll growth since January 2008. We see health care being the only sector that has really grown.
What one should contemplate is these treading water to awful employment reports are about to have a 5 year anniversary. Every month we overview the statistics and it's just beyond reason we are having to report so many unemployed and so little real job growth. It's clear America's employers are not providing enough jobs for America's citizenry.
Here is last month's CES overview, only graphs revised but with more details, links to more tables, information on BLS benchmarks, which were not incorporated in this overview.
Here is our article overviewing November's unemployment statistics.
Best description I've seen so far
This is the best example I've seen so far in nearly 10 years of trying to figure out what happened.
Let me show you the "why"
http://keepamericaatwork.com/wp-content/uploads/2012/02/resemblance.png
The chart above shows the Gross Private Investment portion of the GDP.
I was forced out of work in 2003.
You will notice that every time they quit investing in America we had major job losses.
Now let me show you the "Who"
http://keepamericaatwork.com/?p=208200
There are three "camps" described in that article.
Each of them believes that it is just good business sense to go where the costs are the cheapest which means we either need to find a way to reverse that via peer pressure or via simple regulations like these:
1. It is OK to grow, raise or manufacture your products here in America and sell them to other countries and the same applies to those countries.
2. It is OK to open retail or manufacturing branches in other countries to offset the shipping problems as long as you hire the locals to work in those countries.
3. It is NOT OK to put the people in your country out of work, send the growing, raising or manufacturing to another country and then import those products back into your country.
I bring all of this up because that chart was used in a article that I prepared where I show that the majority of our cities get 75 percent or more of their income to run from property taxes.
Now if we will look at the spreadsheet in the following article, you will see where I lumped together the different categories of jobs, and I did that because I wanted to see where people would end up at as they were forced via layoffs, etc. from middle class.
http://keepamericaatwork.com/?p=208652
As you will see, if you are forced from the high paying jobs averaging $70,000.00 per year, your next lower level will see a average pay of $36,000.00 and your next and last best shot will see you in the $23,000.00 level
Now let's think about property values.
The only ones that can most likely afford homes greater than $200,000.00 are those in the $70,000.00 income group.
Those in the $36,000.00 and $23,000.00 groups most likely will not be able to buy a home worth much more than $200,000.00 and most likely will seek a home in the $100,000.00 to $150,000.00 level
In other words, if we continue to force our middle class to the lower classes by sending our jobs offshore, we eventually will see our property values lowered which means that they either need to substantially raise taxes to cover expenses, or they will end up cutting the bulk of the services provided via mass layoffs.
Being a realtor I've attempted to let the major organizations such as NAR (National Assoc. of Realtors) know, but they either do not want to see it or talk about it.
After ten years of research, the only options I see are to reverse the trends via peer pressure or by adopting those three regulations that I described above.
Keep America At Work