
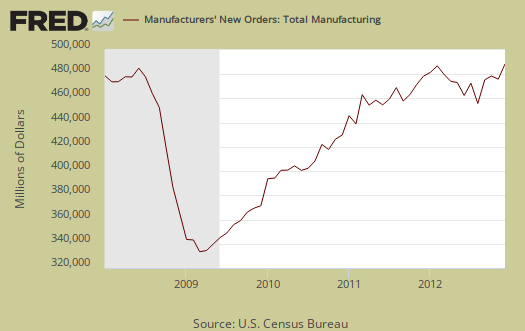
The Manufacturers' Shipments, Inventories, and Orders report shows factory new orders increased 1.8% for December. Without transportation equipment, new orders increased 0.2%. November showed a -0.3% decline whereas October had a 0.8% increase. The Census manufacturing statistical release is called Factory Orders by the press and covers both durable and non-durable manufacturing orders, shipments and inventories.
Transportation equipment new orders increased 11.7% and that was all aircraft and boats. Vehicles bodies & parts new orders declined by -1.2%. Manufactured durable goods new orders, increased 4.3% for December. November durable goods showed a 0.6% increase whereas October had a 1.1% increase in durable goods new orders. Defense communications equipment new orders jumped 30.0% in December. Nondurable goods new orders decreased -0.3% for December, November nondurable new orders declined -0.1% and October showed a 0.5% increase. Nondurables aren't doing so swell for Q4 2012.
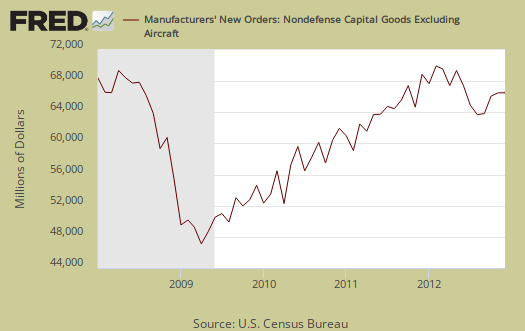
Core capital goods new orders decreased -0.3% for December after 3.3% and 3.0% increases for the two months previous. Core capital goods are capital or business investment goods and excludes defense and aircraft.
Defense capital goods on the other hand, showed a 110.3% increase in December. Graphed below are the revised durable goods news orders. Markets jump on the advance report for durable goods new orders, even though it is revised almost always a week later as statistics are more complete for the month. Notice that durable goods new orders are below pre-recession 2008 levels.

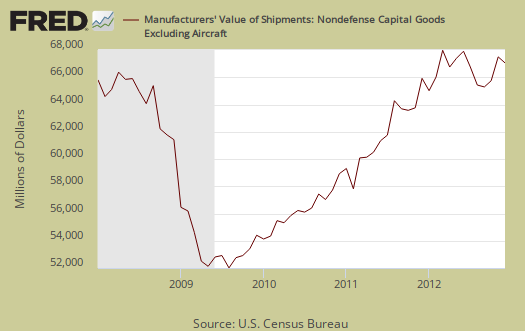
Shipments overall increased 0.4% and November's shipments showed a 0.3% increase. Durable goods shipments improved by 1.1% while nondurables declined by -0.3. Core capital goods shipments showed a modest 0.2% increase, Below is a graph of core capital goods shipments.
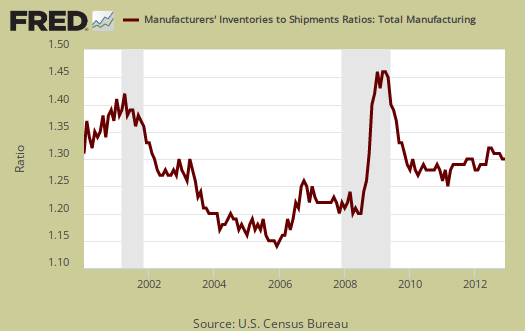
Inventories for manufacturing overall increased 0.1% for December while the two months previous had no change. Durable inventories had no change while nondurables increased 0.2%. Core capital goods inventories declined by -0.4%. Notice the flatness or change between months in the below total inventories graph.

For those believing inventory contraction is over, we don't think so. The report gives inventories by stages of fabrication. Finished goods would be counted in Q4 yet raw materials to be used in production inventories declined, as did works in process, which implies January inventories would not have a magic recovery. .
By stage of fabrication, December materials and supplies decreased 0.3 percent in durable goods and increased 0.4 percent in nondurable goods. Work in process increased 0.4 percent in durable goods and decreased 0.9 percent in nondurable goods. Finished goods decreased 0.3 percent in durable goods and increased 0.6 percent in nondurable goods.
The inventory to shipments ratio is 1.27 and unchanged from November, which again, since inventories are lackluster, implies factory orders really have weak demand.
Unfilled Orders in durable goods increased 0.8% overall with core capital goods unfilled orders declining by -0.4% in December.
Part of this report goes into calculating GDP. The BEA takes this report, called M3, and uses the shipments values to calculate investment in private equipment, investment in software. Manufacturing inventories also goes into the changes in private inventories GDP calculation. At the bottom of this post is a little more information to estimate part of the GDP investment component.
The St. Louis Federal Reserve FRED graphing system has added individual NAICS data series from this report. If you're looking for a graph of some particular NAICS category, such as light trucks, autos & parts, or machinery, it might be found on FRED. Most news outlets source the Commerce Department, while technically correct, also makes it impossible for you, our beloved detailed reader, to find the actual statistical report and data.
There is much more detail in the statistical tables published by the Census website for manufacturing statistics.
Recent comments