
The Manufacturers' Shipments, Inventories, and Orders report shows factory new orders declined by -0.4% for April. That's not a good start for the second quarter although March new factory orders was a blow out of 2.2%. Durable goods new orders doubled down on it's previously published decline and dropped by -1.0%. Transportation new orders dropped by -2.4%. The most frightening statistic is how manufacturing new orders have been negative for eight of the last nine months. That's a pattern folks and not a good one. The Census manufacturing statistical release is called Factory Orders by the press and covers both durable and non-durable manufacturing orders, shipments and inventories.

While transportation equipment new orders plunged by -2.3% , motor vehicles bodies & parts new orders increased by 2.3%. Volatile aircraft new orders declined in nondefense, -3.6% and defense, -11.4%.
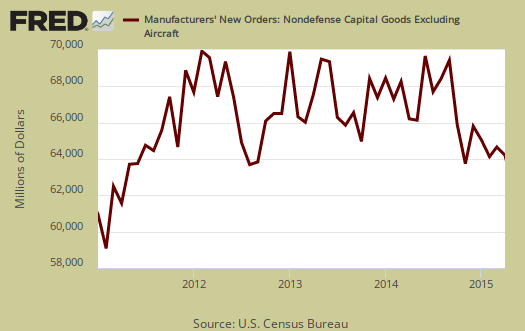
Core capital goods new orders decreased by -0.3%. The previous month showed a 1.6% increase but February was a -5.1% bloodbath. Just not a good way to start another quarter although one month does not investment gains make. Core capital goods are capital or business investment goods and excludes defense and aircraft. This is indicating slower economic growth.
Nondurable goods increased by 0.2%. Manufactured durable goods new orders, decreased -1.0%, shown below.

Shipments had no change for the month, also not a good sign. Nondurable goods shipments increased 0.2%as chemical product shipments increased by 0.5%. Durable goods shipments on the other hand decreased -0.2% as primary metals shipments plunged by -2.2% Core capital goods shipments increased 0.5%. Core capital goods shipments go into the GDP calculation. Below is a graph of core capital goods shipments.

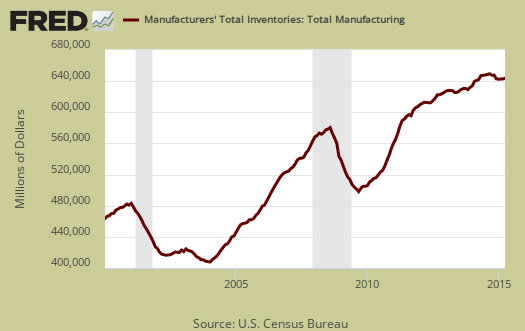
Inventories for manufacturing overall were up 0.1%. Durable goods inventories increased 0.2% while nondurables decreased -0.1%. No one category stood out and petroleum's plunge seems to have ceased.
The inventory to shipments ratio increased from ticked up to 1.35. Increasing ratios can imply economic sluggishness, but this is nothing to worry about as a ratio.

Unfilled Ordersdecreased -0.1%. Core capital goods unfilled orders declined by -0.4% in durable goods decreased -0.1%. Computers & related products unfilled orders increased by 3.4%.
Part of this report goes into calculating GDP. The BEA takes this report, called M3, and uses the shipments values to calculate investment in private equipment, investment in software. Manufacturing inventories also goes into the changes in private inventories GDP calculation. At the bottom of this post is a little more information to estimate part of the GDP investment component.
The St. Louis Federal Reserve FRED graphing system has added individual NAICS data series from this report. If you're looking for a graph of some particular NAICS category, such as light trucks, autos & parts, or machinery, it might be found on FRED. Most news outlets source the Commerce Department, while technically correct, also makes it impossible for you, our beloved detailed reader, to find the actual statistical report and data which you might be focused in on. There is much more detail in the statistical tables published by the Census website for manufacturing statistics.
real factory inventories
in April, producer prices for finished goods were down 0.4%, with prices for major non-durable inventory categories, such as food, energy, and industrial chemicals, down by 0.9%, 2.9%, and 2.8% respectively....that suggests that real April factory inventories rose by something on the order of a half percent over March, and by even more over that of the first quarter, indicating a larger than normal boost to GDP from this single month's data..
rjs