
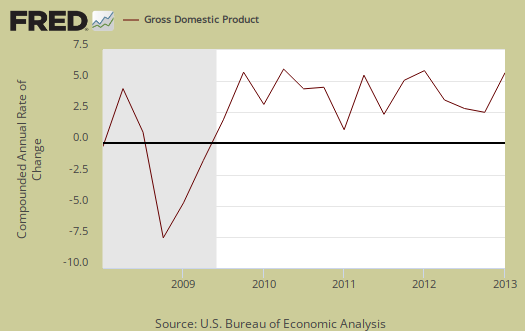
Q1 2013 real GDP came in at 2.5% This is an improvement, from the stagnant economy GDP in the 4th quarter implied. Government spending declines continue to be a drag on the economy and sucked out -0.9 percentage points from 1st quarter real gross domestic product growth. Imports increased and cost the United States -0.9 percentage points of Q1 GDP. Investment recovered on changes to farm private inventories. Consumer spending increased from Q4 as well. Generally speaking 2.5% GDP implies moderate economic growth, yet overall demand in the economy is weak.

As a reminder, GDP is made up of: where Y=GDP, C=Consumption, I=Investment, G=Government Spending, (X-M)=Net Exports, X=Exports, M=Imports*.
The below table shows the percentage point spread breakdown from Q4 to Q1 GDP major components. GDP percentage point component contributions are calculated individually.
| Comparison of Q3 2012 and Q4 2012 GDP Components | |||
|---|---|---|---|
|
Component |
Q1 2013 |
Q4 2012 |
Spread |
| GDP | +2.50 | +0.37 | +2.13 |
| C | +2.24 | +1.28 | +0.96 |
| I | +1.56 | +0.17 | +1.39 |
| G | –0.80 | –1.41 | +0.61 |
| X | +0.40 | –0.40 | +0.80 |
| M | –0.90 | +0.73 | -1.63 |
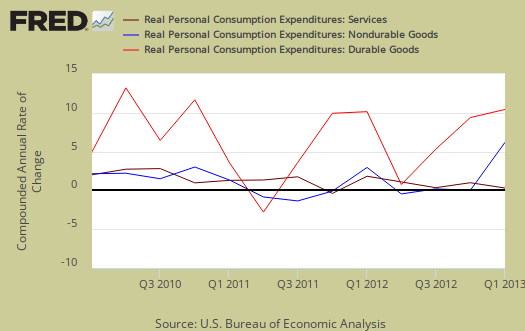
Consumer spending, C in our GDP equation, shows an increase from Q4. In terms of percentage changes, real consumer spending increased 3.2% in Q1 in comparison to a 1.8% increase in Q4. Services drove consumer spending with a 1.58 percentage point contribution in household consumption expenditures. Durable goods consumer spending contributed 0.62 percentage points to personal consumption expenditures. Below is a percentage change graph in real consumer spending going back to 2000.

Graphed below is PCE with the quarterly annualized percentage change breakdown of durable goods (red or bright red), nondurable goods (blue) versus services (maroon).
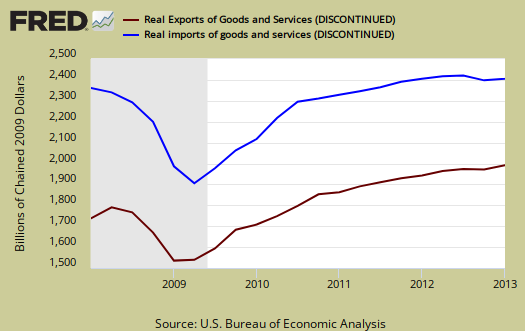
Imports and Exports, M & X subtracted half a percentage point in Q1 GDP contribution as imports increased from Q4 . Import services, which includes offshore outsourcing, increased 6.0% and were -0.17 percentage points of the -0.90 percentage point GDP reduction caused by imports. The below graph shows real imports vs. exports in billions. The break down of the GDP percentage change to point contributions gives a clear picture on how much the trade deficit stunts U.S. economic growth.
Government spending, G was –0.80 percentage points of Q1's GDP, a -4.1% percentage decline from Q4. For the second quarter in a row, there were national defense spending declines, with another –11.5% drop for Q1, a –0.60 percentage point contribution. State and local governments subtracted –0.14 percentage points from Q1 GDP. Below is the percentage quarterly change of government spending, adjusted for prices, annualized.

Investment, I is made up of fixed investment and changes to private inventories. The change in private inventories alone gave a +1.03 percentage point contribution to Q1, with farm inventories contributing 0.78 percentage points of the change in private inventories. Farm inventories saved the Q1 GDP day. Below are the change in real private inventories and the next graph is the change in that value from the previous quarter.


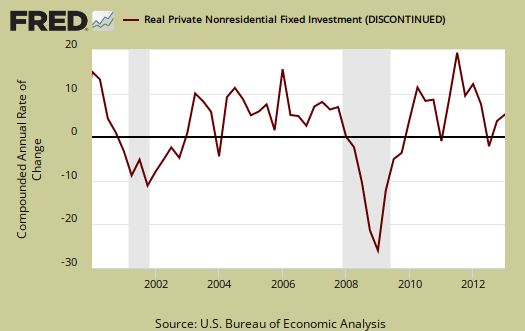
Fixed investment is residential and nonresidential and is a bright spot in the Q1 GDP report, as it was in Q4. Overall, fixed investment contributed +0.53 percentage points to GDP.
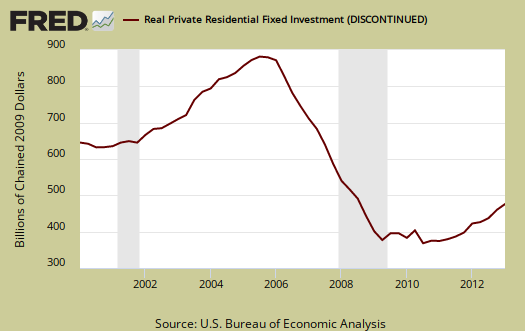
Part of fixed investment is Residential fixed investment. Residential contributed +0.31 percentage points to Q1 GDP. One can see the housing bubble collapse in the below graph and also how there is no meteoric recovery, but a modest one, for Q1, in spite of all of the housing data hype.
Motor Vehicles as a whole, as output was +0.24 percentage points of Q1 real GDP. Computer final sales, subtracted -0.01 percentage points from Q1 GDP. These categories are different from personal consumption, or C sub-components, such as auto & parts. These are overall separate indices to show how much they added to GDP overall. Motor vehicles, computers are bought as investment, as fleets, in bulk, by the government, as well as part of consumer spending, government spending and so on.
Services overall added a +0.90 percentage point contribution to GDP while goods, overall added +1.40 percentage points. Structures, overall, which is building activity, both residential and commercial and economic activity it generates, contributed +0.20 percentage points to Q1 real GDP.
The price index for gross domestic purchases, was 1.1% for Q1 in comparison to 1.6% for Q4. This means there was less inflation in comparison to last quarter. Since the price index is used to remove inflation from GDP to obtain real growth, less inflation means less price increases to eat away at economic growth. The core price index, or prices excluding food and energy products, was 1.3%,an increase of 0.1 percentage point from Q4 .
Nominal GDP: In current dollars, not adjusted for prices, of the U.S. output,was 16,010.2 trillion, an 3.73% increase from Q4's $15,864.1 trillion. All figures are annualized.
Real final sales of domestic product is GDP - inventories change. This gives a better feel for real demand in the economy. This is because while private inventories represent economic activity, the stuff is sitting on the shelf, it's not demanded or sold. Real final sales increased 1.5% for Q1, which reflects weak demand. Q4 real final sales increased 1.9%.

Below are the percentage changes of Q1 2013 GDP components, from Q4. There is a difference between percentage change and percentage point change. Point change adds up to the total GDP percentage change and is reported above. The below is the individual quarterly percentage change, against themselves, of each component which makes up overall GDP. Additionally these changes are seasonally adjusted and reported by the BEA in annualized format.
|
Q1 2013 Component Percentage Change (annualized) |
|||
|---|---|---|---|
| Component | Percentage Change from Q4 | ||
| GDP | +2.5% | ||
| C | +3.2% | ||
| I | +12.3% | ||
| G | –4.1% | ||
| X | +2.9% | ||
| M | +5.4% | ||
The BEA's comparisons in percentage change breakdown of 4th quarter GDP components are below. Changes to private inventories is a component of I.
C: Real personal consumption expenditures increased 3.2 percent in the first quarter, compared with an increase of 1.8 percent in the fourth. Durable goods increased 8.1 percent, compared with an increase of 13.6 percent. Nondurable goods increased 1.0 percent, compared with an increase of 0.1 percent. Services increased 3.1 percent, compared with an increase of 0.6 percent.
I: Real nonresidential fixed investment increased 2.1 percent in the first quarter, compared with an increase of 13.2 percent in the fourth. Nonresidential structures decreased 0.3 percent, in contrast to an increase of 16.7 percent. Equipment and software increased 3.0 percent, compared with an increase of 11.8 percent. Real residential fixed investment increased 12.6 percent, compared with an increase of 17.6 percent.
X & M: Real exports of goods and services increased 2.9 percent in the first quarter, in contrast to a decrease of 2.8 percent in the fourth. Real imports of goods and services increased 5.4 percent, in contrast to a decrease of 4.2 percent.
G: Real federal government consumption expenditures and gross investment decreased 8.4 percent in the first quarter, compared with a decrease of 14.8 percent in the fourth. National defense decreased 11.5 percent, compared with a decrease of 22.1 percent. Nondefense decreased 2.0 percent, in contrast to an increase of 1.7 percent. Real state and local government consumption expenditures and gross investment decreased 1.2 percent, compared with a decrease of 1.5 percent.
Here is our overview for Q4 GDP previous estimate, Other reports on gross domestic product can be found here.
Recent comments