
The BLS JOLTS report shows once again record high job openings. While Wall Street cheers and proclaims the long bad jobs market over, not so fast. Actual hiring still has not recovered to even the 2007 prerecession levels. The Job Openings and Labor Turnover Survey shows there are 1.4 official unemployed per job opening for July 2015. While job openings were almost 5.8 million, hires were below five million, quite a divergence. In just the private sector job openings recovered to pre-recession levels in April 2014, while private hires are 4.1% below their pre-recession levels. The soaring job openings give an illusion of a red hot jobs market, but hires paint a very different, bleak picture.
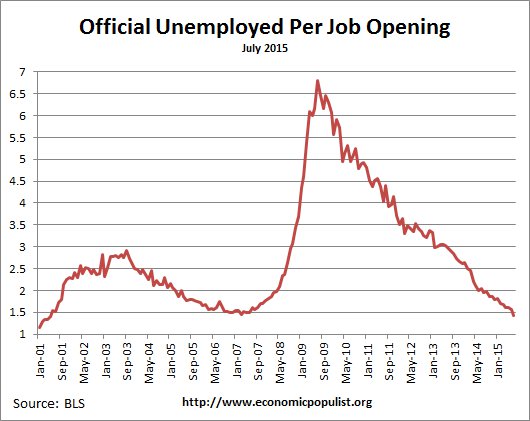
There were 1.8 official unemployed persons per job opening at the start of the recession, December 2007. Below is the graph of the official unemployed per job opening, currently at 1.44 people per opening. This ratio is at the lowest level since March 2007.
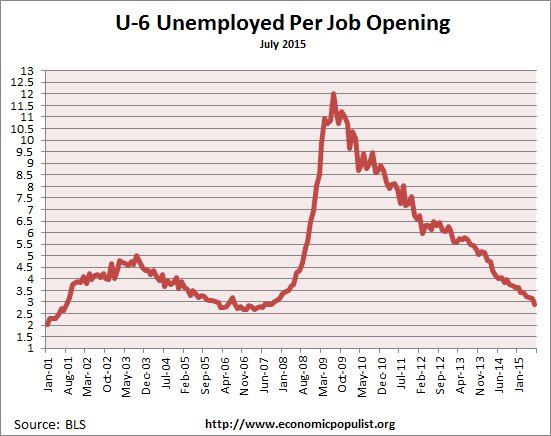
If one takes the U-6 broader measure of unemployment that includes people who are forced into part-time work and the marginally attached, the ratio is 2.87 people needing a job to each actual job opening. In December 2007 this ratio was 3.2. Here too we see great ratios regarding job openings. This is the lowest ratio since August 2007.
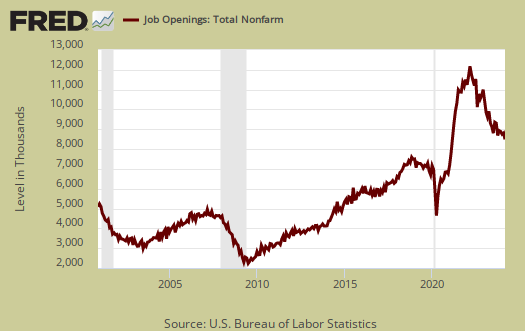
Job openings are soaring past pre-recession levels. Yet population increases, so having raw numbers come up to levels from eight years ago and so many stopped looking for work belies the level and ratios. Currently job openings stand at 5,753,000, a record since the BLS started tracking on job openings.
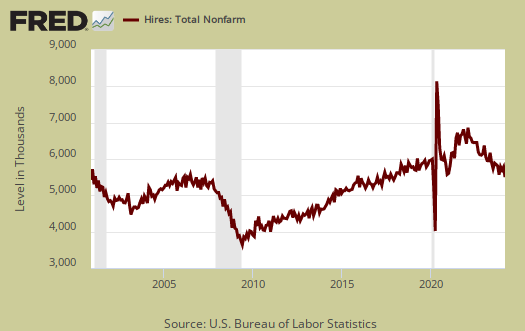
Below is the graph of actual hires, currently 4,983,000. Since the June 2009 trough, actual hires per month have increased 36.6%. Recession hiring really didn't cliff dive like layoffs, firings and openings did, yet for months now openings have soared while actual hiring isn't. None of these figures are adjusted for population growth, which shows how badly the labor pool has really shrunk. Also, Businesses can say there have job openings, but if they do not hire an American and fill it, so what about the reported opening? The tech industry is notorious to put out false job ads with no intention of hiring an actual American worker. It is most telling that professional and business services reported a +452,000 gain in job openings. One might check the H-1B and other guest worker Visas being issued or demanded for next year, as it seems quite improbable that the broad field needs almost half a million more workers in the space of a year. During that same time period the hires in the do you want fries with that accommodation and food services sector jumped up by 113,000 while hires in professional and business services actually dropped by -60,000. Did we point out that tech companies put out fake job openings to scream labor shortage in order to demand more guest worker Visas in order to import cheap labor?
Graphed below are total job separations, currently at 4.716 million. The term separation means you're out of a job through a firing, layoff, quitting or retirement and is also called turnover. From a year ago, separations are almost at the same level, 4,711,000.
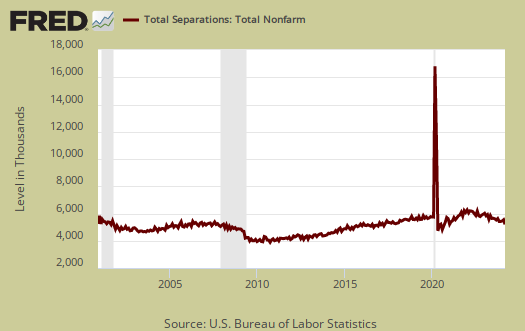
Layoffs and firings were 1.609 million, a -9.6% monthly change, which is quite a large swing. Below is a graph of just layoffs and firings. One can see from labor flows businesses are not thrashing their workforce as much, relatively speaking, for some time in 2015. Labor flows means the way people are hired, stay at a job, quit, get fired, get another job and so on. It is the overall flow of the labor market for as people are get jobs, they also lose them.

Graphed below are openings, separations and hires levels, so we can compare the types of labor flows. While layoffs have declined to pre-recession levels, it is the hires (blue) that needs to increase even more. The below figures also disprove a labor shortage since one would have more job openings than the unemployed.

Graphed below are people who quit their jobs minus those who were fired and laid off. The lower the bar on the below graph, the worse labor conditions are. Quits are what they sound like, workers quit their current jobs often to obtain better ones. People feeling free enough to leave their current positions is considered a positive labor market sign. Quits were 2.695 million. Private sector quit statistics are now 5.1% below the November pre-recession level.

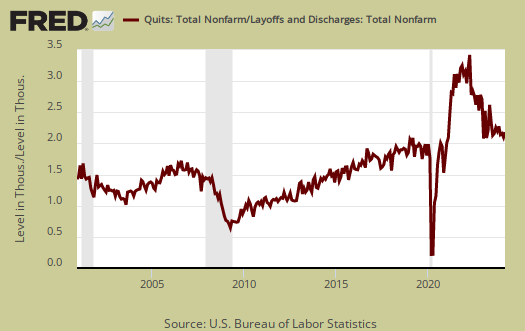
Below is a graph of the quits to layoffs ratio, currently at 1.7. This ratio of people who quit their jobs vs. those who were fired gives an indicator of worker churn as well as if there might be a shortage. If the ratio is below 1.0, this means more people are being laid off and fired than people who quit. When the ratio is much higher, this means more people quit their jobs and thus implies there is better opportunity elsewhere and workers feel free enough to move on to obtain those new better jobs. The quits to fires ratio was 1.9 in 2006.
For the year, there was a gain of 2.7 million employed. Bear in mind employment duration in so called permanent jobs these days is very low, so due to labor flows the net gain of jobs over time belies the monthly headline buzz of jobs gained. From the JOLTS report:
Over the 12 months ending in July 2015, hires totaled 60.6 million and separations totaled 57.8 million, yielding a net employment gain of 2.7 million. These totals include workers who may have been hired and separated more than once during the year.
Below is the BLS graph of job openings against hires and then quits. Notice how openings have exceeded hires in the past months, defying the historical JOLTS norm, while quits are still below pre-recession levels. This graph really shows all is not well with the jobs market. These days so many employers try to import foreign workers instead of hiring Americans for jobs, one must wonder if that is the real reason for so many job openings. Businesses try to justify importing cheap labor for their offshore outsourcing purposes by claiming there is no qualified American. That simply isn't true at all, there are plenty of out of work Americans capable of doing these jobs.
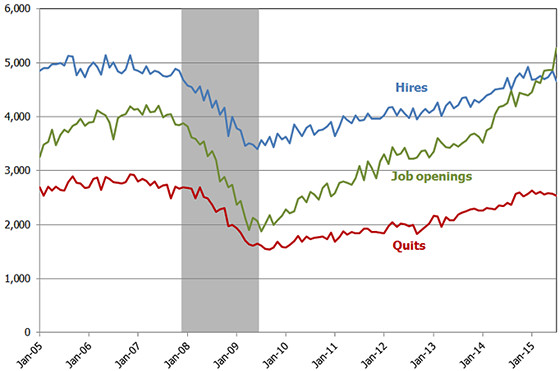
The BLS publishes highlights in a separate report and the analysis on hires is most telling. For the first time in report history, there is a pattern of more openings than hires. That's not a good thing and by focusing in on openings versus hires, one gets a false impression the jobs market is better than it actually is. Here are the BLS bullet points which imply the lack of hires is most troubling:
- The number of hires has exceeded the number of job openings for most of the JOLTS history. Over the past year, this relationship has changed as job openings have outnumbered hires for several months.
- Hires exceeded job openings for over thirteen years, between December 2000 and July 2014. Job openings exceeded hires for the first time in August 2014, although hires then outnumbered job openings for the next five months. Since February 2015, however, this new relationship has persisted with job openings exceeding hires for six consecutive months.
- At the end of the most recent recession in June 2009, there were 1.3 million more hires throughout the month than there were job openings on the last business day of the month.
- In July 2015, there were 770,000 fewer hires throughout the month than there were jobopenings on the last business day of the month.
For the JOLTS report, the BLS creates some fairly useful graphs beyond the above and they have oodles of additional information in their databases, broken down by occupational area. That said, one doesn't know if the openings are quality jobs from the JOLTS statistics.
The JOLTS takes a random sampling of 16,000 businesses and derives their numbers from that. The survey also uses the CES, or current employment statistics, not the household survey as their base benchmark, although ratios are coming from the household survey, which gives the tally of unemployed.
The July 2015 unemployment rate was 5.3%. U-6 alternative unemployment rate was 10.4%. JOLTS includes part-time jobs and does not make a distinction between part-time, full-time openings. A job opening reported to the survey could literally be take out the trash twice a week and be counted. This is a shame, it would be nice to know a little more about the quality of these new opportunities. Here are our past JOLTS overviews, unrevised.
Where’s the Beef?
Where are the signs of strength in the overall labor market? If the labor market was beefing up there would be upward prices on labor. The price of labor has been flat or down for years and it is not going up. Even skilled labor is falling behind due to understated rates of inflation eroding its real buying power. Corporate Republicans and pandering Democrats are salivating at the prospect of legalizing millions of undocumented slaves. Only the Progressive fringe opposed the job stealing TPP while they were otherwise busy throwing everyone making less than $20 per hour under the immigration bus. The bottom and middle of working America, now underwater, is being torpedoed again. Do we really need a bombastic xenophobic racist war mongering climate denying blowhard with bad hair to save working America? I’d ask a Democrat but they’re all appearing on Univision supporting Gay Marriage and Women’s Rights.
The climate change tax is
The climate change tax is going to be the final nail in the middle class coffin. This is a massive $ 1 trillion tax hike that will be paid out in terms of higher electric bills. If your bill is 3x higher, so is the grocery down the street. This is going to create a massive inflation bomb. Between that and the ever-rising insurance premiums we pay, the monthly budget continues to get hammered, and the middle class has very little left over.
Putting things in perspective
The climate change tax is your grandchildren dying on a despoiled world left unfit for human habitation, devoid of basic resources, poisoned by ignorant, uncaring selfish people who will go to their grave taking the future of their progeny with them.