
The August 2011 ISM Manufacturing Survey dropped 0.3 percentage points to 50.6%. This is a pleasant surprise since most were expecting a cliff dive after the Philly Fed index plunge earlier. So much for correlations. These days a signal manufacturing is treading water is taken as a blessing, although the production index hasn't been this low since May 2009 and new orders are contracting. Below is the manufacturing composite index, PMI and as one can see PMI just hit 2008 levels.

New Orders increased +0.4 percentage points from last month and is just on the side of contraction, 49.6%.
A New Orders Index above 52.1%, over time, is generally consistent with an increase in the Census Bureau's real series on manufacturing orders

Production, which is the current we're makin' stuff now meter, dropped -3.7 percentage points from last month and is contracting. Production correlates to the Federal Reserve's industrial production, where the August figures will be out mid-September.

Below is the ISM table data, reprinted, for a quick view. It shows Economic Armageddon has been postponed, sorry to disappoint you.
| MANUFACTURING AT A GLANCE June 2011 | ||||||
|---|---|---|---|---|---|---|
| Index | August | July | % Point Chg. | Direction | Rate | Trend |
| PMI | 50.6 | 50.9 | -0.3 | Growing | Slower | 25 |
| New Orders | 49.6 | 49.2 | +0.4 | Contracting | Slower | 2 |
| Production | 48.6 | 52.3 | -3.7 | Contracting | From Growing | 1 |
| Employment | 51.8 | 53.5 | -1.7 | Growing | Slower | 23 |
| Supplier Deliveries | 50.6 | 50.4 | +0.2 | Slowing | Faster | 27 |
| Inventories | 52.3 | 49.3 | +3.0 | Growing | From Contracting | 1 |
| Customers' Inventories | 46.5 | 44.0 | +2.5 | Too Low | Slower | 29 |
| Prices | 55.5 | 59.0 | -3.5 | Increasing | Slower | 26 |
| Backlog of Orders | 46.0 | 45.0 | +1.0 | Contracting | Slower | 3 |
| Exports | 50.5 | 54.0 | -3.5 | Growing | Slower | 26 |
| Imports | 55.5 | 53.5 | +2.0 | Growing | Faster | 24 |
| OVERALL ECONOMY | Growing | Slower | 27 | |||
| Manufacturing Sector | Growing | Slower | 25 | |||
Now we come to employment. Where are the damn jobs? The manufacturing ISM employment index dropped yet another -1.7 percentage points to 51.8%, yet is still above 50.1, the neutral point for hiring vs. firing. The ISM manufacturing employment index for November 2009 was 50.4% and the U.S. lost 44,000 manufacturing jobs in that month.
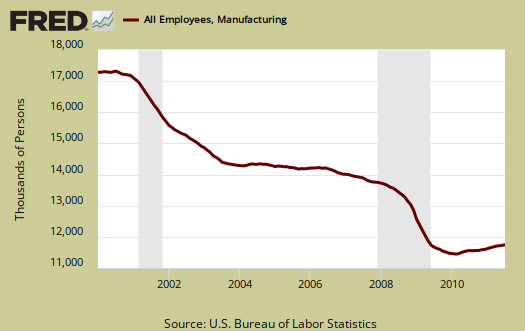
Below are the BLS manufacturing non-farm payrolls (jobs) for the past decade on the left (August's numbers are out tomorrow), graphed against the ISM manufacturing employment index on the right. The BLS number is simply raw manufacturing jobs tally, not taking into account population growth or overall sector shrinkage as well as time lag. One can eyeball a slight correlation in the middle of the decade, yet note the divergence this recovery, starting late 2008.
Inventories increased +3.0 percentage points to 52.3% and moved from contraction to expansion. In Q2 GDP changes in private inventories leveled. Manufacturing's customer inventories also increased 2.5 percentage points to 46.5.

Exports new orders plunged -3.5 percentage points to 50.5%. This follows other nations' PMIs, which imply a global slowing of trade. Europe PMI came in at 49, China 50.9, which increased and the U.K. was 49. The Wall Street Journal just created a chart listing PMI by countries to show the global manufacturing slowdown.

Import increased 2 percentage points to 55%. These are materials manufacturers use to make their products.
Prices dropped -3.5 percentage points to 55.5% and is the 4th consecutive month prices have dropped below 80 since December 2010, although still above 50 and the ISM reports this is the 26th month for that. Prices are what manufacturers pay to make their products.

In terms of which industries are officially contracting, the ISM lists 6, Plastics & Rubber Products; Textile Mills; Nonmetallic Mineral Products; Electrical Equipment, Appliances & Components; Apparel, Leather & Allied Products; and Primary Metals.
The ISM has a correlation formula to annualized GDP, but they are now noting the past correlation, versus current, probably due to the 0.04% Q1 and 1.0% Q2 GDP growth for 2011. Annualizing August's data, the ISM get a 2.8% 2011 GDP, which is higher than most analysts are forecasting, including the optimistic OMB's 1.7% GDP forecast for 2011.
If the PMI for August (50.6 percent) is annualized, it corresponds to a 2.8 percent increase in real GDP annually
The ISM neutral point is 50. Above is growth, below is contraction, although the ISM is this report is noting some variance in the individual indexes. For example, A PMI above 42, over time, also indicates growth.
Last month PMI was 50.9%. The graphs, not text, should also have any revisions.
The ISM has much more data, tables and analysis on their website. For more graphs, see St. Louis Federal Reserve Fred database and graphing system.
A mixed blessing
"These days a signal manufacturing is treading water is taken as a blessing" -- Robert Oak
A mixed blessing!