
The April 2012 monthly unemployment figures show the official unemployment rate dropped a 10th of a percentage point to 8.1% due to people dropping out of the labor force. Total nonfarm payroll jobs gained were 115,000. Total private jobs came in at 130,000, with 21,100 of those jobs being temporary. Government jobs dropped, -15,000. While manufacturing gained 16,000 jobs, transportation and warehousing dropped -16,600 jobs. It takes about 100,000 jobs each month just to keep up with population growth so this is a terrible report for the American worker.

March's payroll jobs were revised from 120,000 to 154,000, a gain of 34,000 jobs than originally reported. February payrolls were revised, up from 240,000 to 259,000. Below is a graph showing the monthly change in nonfarm payrolls employment.
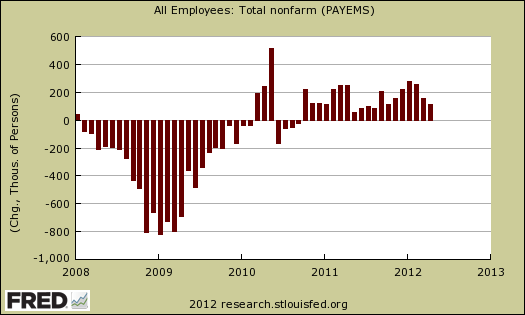
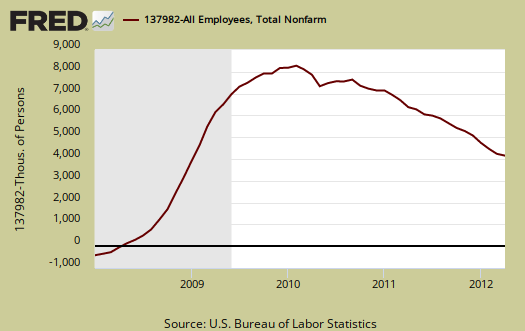
America has one hell of a payroll jobs deficit. The start of the great recession was declared by the NBER to be December 2007. By looking at the start of the great recession, we can calculate how many jobs we're still down from that fateful 2007 December. With the April payrolls growth, the United States is now down -4.993 million jobs.

Below is a running tally of how many official jobs permanently lost, from the establishment survey, since the official start of this past recession. Increased population growth, implies the United States needs to create at least 10.4 million jobs or self-employment, using the population survey statistics. This estimate assume a 62.7% civilian non-institutional population to employment ratio, as it was in December 2007. This implies an additional 5.4 million jobs were needed over a 52 month time period beyond the ones already lost. This is just taking into account increased population against the payroll jobs gap, the actual number of jobs needed is much higher, in part because payrolls, CES, and population, CPS, are two separate data surveys from the BLS.
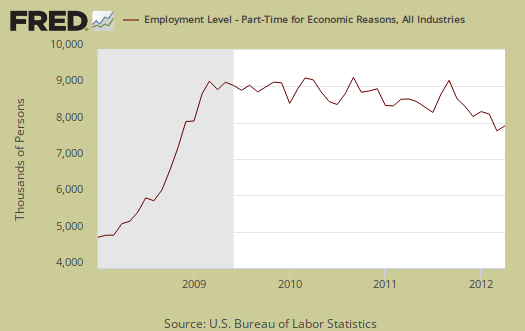
Another problem with the employment market is the gross number of part-time jobs generally. There is a huge number of people who need full-time jobs with benefits who can't get decent jobs. Those forced in part time jobs increased by 181,000 in April. Of the 141.87 million employed as reported from the current population survey, there are still 7.85 million of the 26.69 million part-timers working low hours because they cannot get full time jobs. That's a hell of a lot of people stuck in part-time jobs who need full-time work.
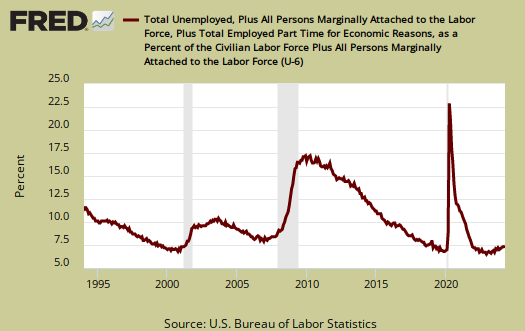
U-6 is a broader measure of unemployment and includes the official unemployed, people stuck in part-time jobs and a subgroup not counted in the labor force but are available for work and looked in the last 12 months. Believe this or not, U-6 still leaves out some people wanting a job who are not considered part of the labor force. U-6 has also remained consistently high and for April the U-6 alternative unemployment rate was 14.5%.
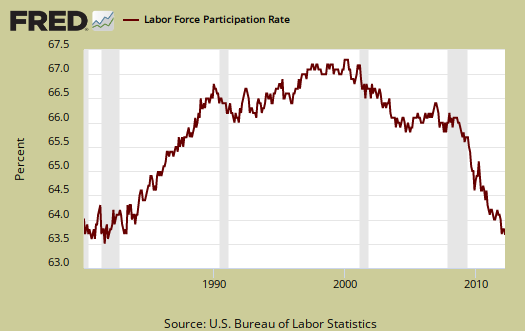
The labor participation rate, dropped -0.2 percentage points to 63.6% and hasn't been this low since December 1981! If we go back to December 2007, the labor participation rate was 66%. The highest civilian labor participation rate was in January 2000, at 67.3%. What this means is there are over 5.83 million people not be accounted for in the official unemployment rate, in other words counted as employed or unemployed, many who probably need a job and can't find one. That's in addition to the official 12.5 million unemployed.
The employment to population ratio is now 58.4%, at record lows and dropping a 10th of a percentage point from last month. You have to go back to the severe recession of 1983, October to find such low ratios, but in the 1983 case, the low ratios were short lived. Now we have a persistently low employment to civilian noninstitutional population ratio! The low employment to population ratio clearly includes people dropping out of the labor count. we can see this by the cliff dive employment to population ratio during 2008-2010. There is no way magically, suddenly, a huge increase of population volunteered to drop out of the labor force, turned 65 at once, or magically all went to school. Remember that cliff dive in employment to population ratio represents about 10 million people. There is no way roughly 11 million people more people retired or went off to school in the space of two years as amplified by the drop in labor participation rates for those between ages 25-54, the prime working years.
These numbers are important because unemployment is a ratio, percentage or during a limited time period, the number of people actively looking for a job and counted. Many people are not counted in the official unemployment statistics, yet when looking behind the official numbers it's clear America has more potential workers and less jobs in so called recovery than during one of the worst post WWII recessions.

How did the U.S. only add 115,000 jobs yet the unemployment rate dropped? First, these are two separate surveys, the jobs number comes from the CES, or establishment survey where the unemployment ratios comes from a different survey, the CPS, otherwise known as the Household survey. The unemployment rate is a ratio of those officially unemployed to those officially counted as part of the labor force.
Less people were considered part of the labor force in April. Those not in the labor force jumped by 522,000 while overall non-institutional population rose by 180,000. The civilian labor force decreased by -342,000, whereas those officially unemployed decreased by -173,000. Yet those officially employed also decreased by -169,000. In other words, people fell out of the official unemployment count.
We'll have more details overviewing this month's unemployment report in later posts, including looking at labor participation rates by age bracket, duration of employment and ratios of people stuck in part-time jobs when they need full-time work.
For more information on how the BLS tabulates non-farm payroll jobs, see this article, Under the Hood of the Employment report.
list of other articles on the April employment report
We break up overviewing the monthly employment statistics due to the report's complexity and importance.
In this post is an alternative unemployment rate, calculated by us, plus duration, part-time workers.