
Q2 2010 GDP was revised significantly down, to 1.6%. The advance report on Q2 2010 GDP was 2.4%. Here is the actual revised GDP report. That is an 0.8 percentage point revision, or one third lower GDP than the advance report.

As a reminder, GDP is made up of:
where
Y=GDP, C=Consumption, I=Investment, G=Government Spending, (X-M)=Net Exports, X=Exports, M=Imports.
Here is the Q2 2010 revised report breakdown of GDP percentage points:
- C = +1.38
- I = +2.75
- G = +0.86
- X = +1.08
- M = -4.45
Here is the Q2 2010 advance report breakdown of GDP percentage points:
- C = +1.15
- I = +3.14
- G = +0.88
- X = +1.22
- M = -4.00
Here are the differences between the advance and revised Q2 2010 GDP report:
- C = +0.23
- I = -0.39
- G = -0.02
- X = -0.14
- M = -0.45
If you're not uttering holy shit over the trade deficit at this point, I think you should consider medication for delusional thinking.
The ratio of imports to exports in real dollars is over 4 to 1. The trade deficit now contributes -3.37 percentage points of the total 1.6% Q2 2010 GDP.
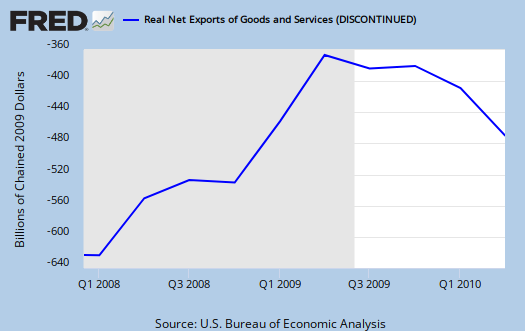
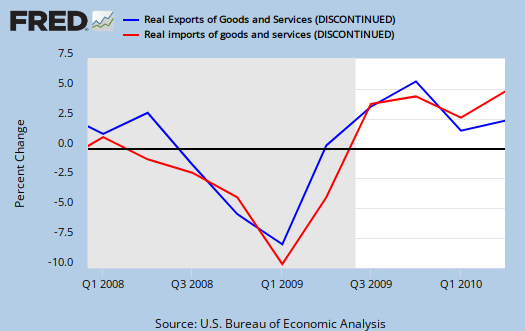
The below graph is the change, quarterly, of real imports vs. exports. Notice that exports decreased from Q1 to Q2 2010. The real whopper is the trade deficit. So much for the claim the U.S. is going to increase exports instead of confronting current trade policy and China.
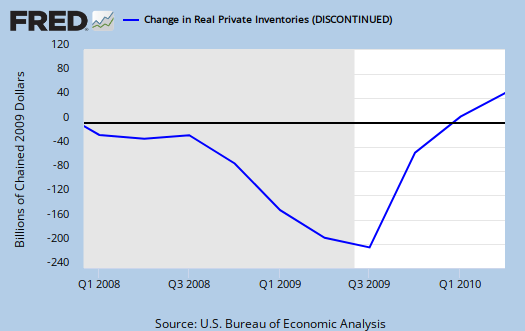
Changes in inventories contributed 0.63 of the total 1.6%, or minus inventory changes, Q2 2010 GDP would have been 0.97%. The advance report had changes in inventories contributing 1.05 of the total 2.4% GDP point percentage, so that is a revision drop of 40% in inventories from the advance report.
The good news (if anything good at all can be found in this report), is investment in equipment and software contributed 1.53, or 0.17 more to the revised GDP numbers than the advance report. Overall fixed investment, not including changes in inventories, contributed 2.12 percentage points to Q2 2010 GDP.
That's $25 billion dollars less than the original report. Who feels like we should be eating bananas in our Republic?
The United States reports GDP numbers annualized. So, realize when comparing to other nation's GDP reports, some report quarterly numbers, not annualized.
Also, these are national accounts, so one must use price multipliers when going from other economic reports, such as trade to the GDP report numbers.
Subject Meta:
Forum Categories:
| Attachment | Size |
|---|---|
| 165.29 KB |
Recent comments