
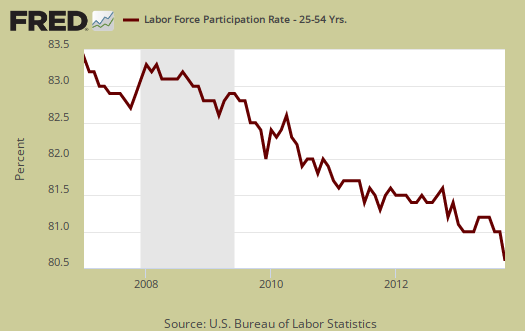
The October unemployment report showed a record low labor participation rate of 62.8%, graphed below. Many dismiss these record low labor participation rates by claiming more people are retiring and young people are just in school. Is this true or is something more sinister going on? Are people simply dropped out of the labor force who in fact really need a job are is it as they say, older Americans are enjoying their golden years, no longer needing to work and all the kids are just lining the higher education halls?
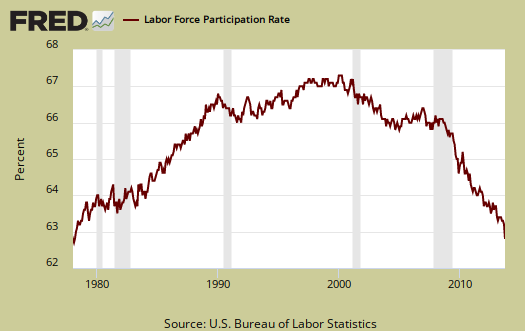
It is true the labor participation rate has declined since 2000, about a percentage point from that time until just before the recession. Yet after October 2007 the labor participation rate has declined by 3.2 percentage points, a much faster rate than before the recession. The labor participation rate is a ratio of the population, not locked up somewhere, sick or in the military, age 16 or older, who are participating in the labor force by either looking for a job or have one.
To take a look at the finite details of labor participation, we must use raw data for seasonally adjusted labor statistics are not available at this level of granularity. To get any sort of validity from using not seasonally adjusted data, we must compare figures to one year ago to remove seasonality from the patterns. Labor markets are highly seasonal, think summer jobs and temporary holiday help and one gets the idea. For this analysis, we're going to use October as our month to compare to past years since this is the most recent month available for labor statistics. Bear in mind there is a month to month margin of error with the BLS current population survey unemployment statistics. Below is the labor participation rate, not seasonally adjusted, for just the month of October going back to 1999.
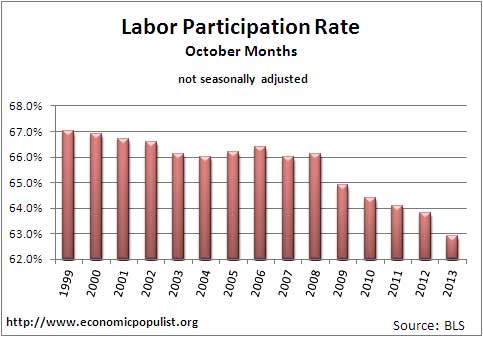
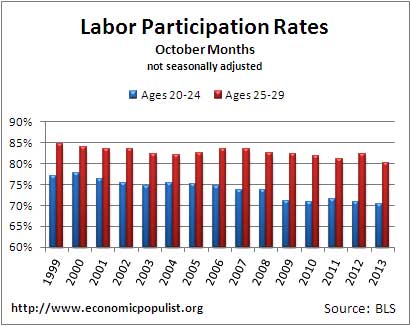
As we can see the not seasonally adjusted labor participation rate using just October month's has declined by 3.1 percentage points since October 2007. With this decline as our baseline, the below graphs show the labor participation rates by age, broken up in the finest age increments available. Note the age brackets in each graph as the data was broken up for readability.
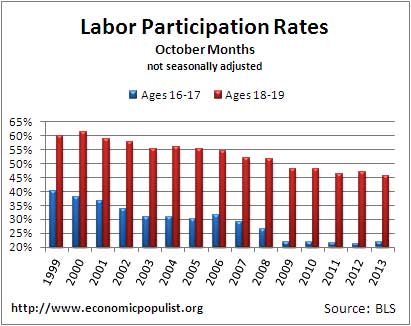
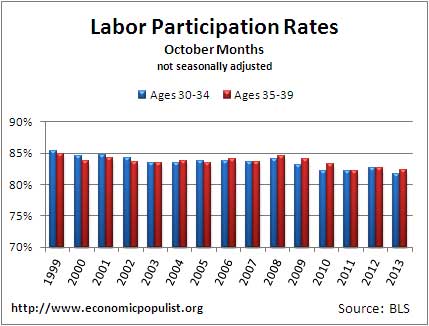
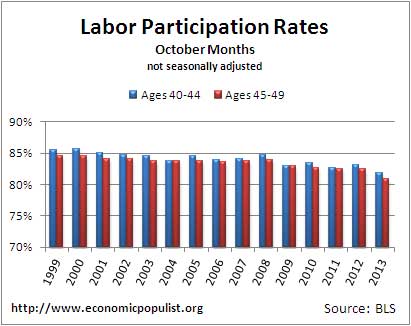
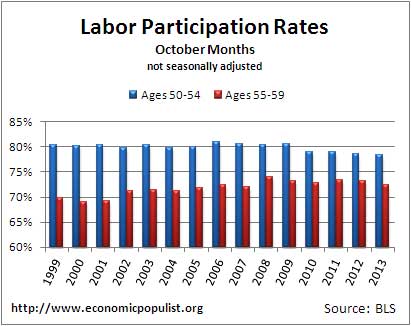
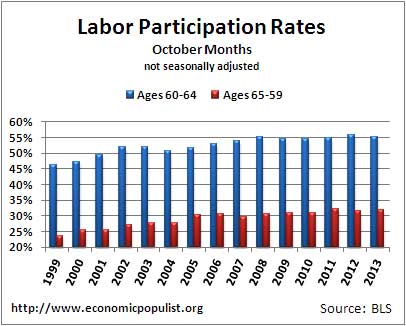
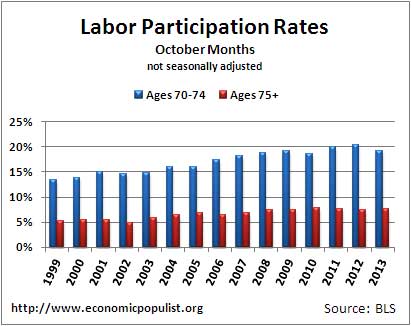
We can see from the above young people are participating dramatically less in the labor market now in comparison to 1999. We can also see more people over the age of 60 are either working or looking for work as well. We question why the labor participation rate plunged for teenagers and suspect that they have been pushed out of those burger flipper and agriculture summer jobs by illegals and older workers. Regardless of the reason, their plunging labor participation rates are why many pundits and even economists claim the overall decline in labor force participation is nothing to worry about. Read on to see if that is true.
The labor participation rate is all of the people not infirm, in the military or locked up somewhere who are either employed or actively looking for work. When one calculates labor participate rates by age bracket, the aging population is already accounted for for the figure is calculated from the age of a person at that time. The Labor participation rate is the civilian labor force divided by the civilian noninstitutional population and by age, it is the same calculation.
Below is a pie chart showing the breakdown of the civilian noninstitutional population by age for October 2013 and this is not seasonally adjusted. We're going to use this breakdown of the population by age to prove again that the dropping labor participation rate is not due to retirement or more young people going to school as this myth, which is continually perpetuated without fact or figures, needs to be dispelled.
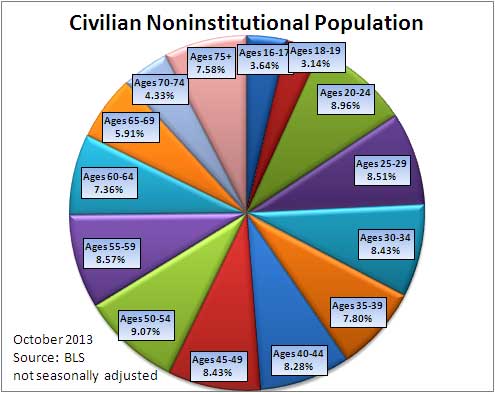
The above pie chart is ridiculous to look at, we know. The point of this very busy pie chart is to show we have the data to break down the population from where the labor force will come from by age and at a moment in time. Therefore, we can calculate what the contributions to the overall labor participation rate decline are per age group for a given time period. People get older over time and move into different age brackets, but no worries, we can account for that fact to get some answers on labor participation.
Below is the change per age brackets in October to October not seasonally adjusted labor participation rates for 2012, 2009 and 2007. We can see that young people have just imploded in their labor market participation, yet those over the age of 65 are participating more than in the past.
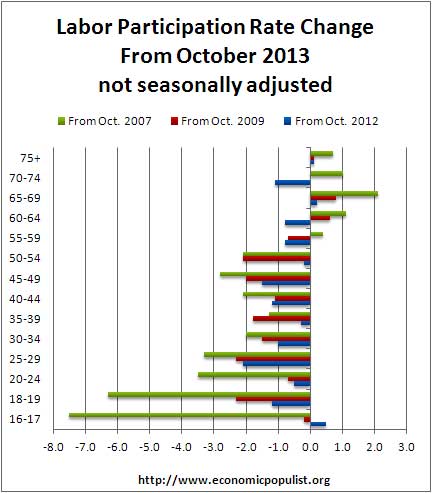
We can assuredly assume people ages 30 to 59 are in their prime working years and thus eliminate the claim the baby boomers are causing the labor participation rate to drop as well as young people all magically going into massive debt as they are all in higher learning institutions. Additionally, we remove some age discrimination from our examination by removing the 25 to 29 and 60 to 64 year olds out of the equation to see what's going on with labor participation rates. Of course this increases the focus on the peak earning age groups, even though obviously 25 year olds and 60 years olds still need to make rent like everybody else. People do go back to school at all ages, yet let's assume age 30 to 59 year old students not working while attending school are a very small percentage or this population group.
We can then weight the 30 to 59 year old labor participation rate by their percentage of the civilian noninstitutional population, thus getting their contribution to the overall labor participation rate for those aged 16 and older. How this weighting is done for all age brackets is to multiply the percentage of the total noninstitutional population each age bracket is (our ugly pie chart above), by the labor participation rate for that age bracket.
For just the age group of 30 to 59 year olds, they account for 0.73 of the 0.96 percentage point drop in the overall unadjusted labor participation rate from a year ago. The same age group is responsible for 2.29 of the 2.06 percentage point drop in the overall unadjusted labor participation rate from October 2009 to October 2013. The reason the 30 to 59 year olds 2009 to 2013 labor participation rate plunge is greater than the overall decline is due to older workers increasing in their labor participation as shown in the above graphs for ages 60 and above. From October 2007 to October 2013 the 30 to 59 year olds participating in the labor force accounted for 3.0 of the 3.1 percentage drop in the labor participation rate, unadjusted, using October to October labor force statistics.
In other words, the 30 to 59 year olds, who make up 50% of the population which has the potential to work, account for pretty much all of the labor participation rate plunge since 2007. This same age group accounts for three quarters of the labor participation rate decline of the past year.
Anyone who insists the record low labor participation rate is due to baby boomers and people retiring is flat out wrong. It is clear the labor participation rate is dropping for people in the prime working years. Any way one slices it, the shrinking labor force is not due to baby boomers or magically all young people went off studying their hearts out. Anyone can do the above exercise to prove it. All one needs is a spreadsheet, access to the Internet to obtain BLS data and a hell of a lot of time.
If the above did not convince you the labor participation rate has declined due to a lack of jobs and people dropping out of the count, you might read this post from 2012 showing the same results, but with more robust data by using moving annual averages of labor participation rates by age. For those pointing to the one percentage point drop in labor participation from 1999 until 2007, may we remind those folk there was another recession, 9/11 happened, the dot con bust occurred and offshore outsourcing started in earnest.
Finally, if one still isn't convinced there is a very fast reality check labor participation is declining in the prime working years. The BLS publishes a seasonally adjusted monthly labor participation rate for those between the ages of 25 and 54. For all those people who believe it is perfectly ok to age discrimination against workers in their 50's or believe people can retire early as a rule (they cannot), this is the metric to look at. Since a year ago, the labor participation rate for 25 to 54 year olds has fallen by -1.0 percentage point. From October 2009, the labor participation rate for 25 to 54 year olds declined by -2.0 percentage points and from October 2007 there is a -2.2 percentage points rate drop in the labor participation rate for this age group.
Anyone interested in labor participation rates
If the revisions are significant to civilian labor force (CPS) statistics, I might update this article with the revised figures and/or taking the annual moving averages of not seasonally adjusted data for all calculations.
Using the average of 11/12 to 10/13 against the average of 11/11 to 10/12 and so on removes more variance between the monthly changes. The result is the same of course, but for non-believers it is a more robust calculation.
Behind this article is a four page spreadsheet and all calculations were checked against published aggregate numbers. In other words, the calculations used for this article have already been checked for accuracy and validity.
Employment statistics
I am getting so sick of scam articles like this. I wonder why the 'author' chose to only show results from the month of October. Couldn't be that it was the month that agreed with his biased political message, could it? Nah, if the other months showed that a significant percentage of the change in employment IS due to aging and longer student status, he would have told us, right? I mean he's a really honest, forthright guy, isn't he? Even silly headline phrases like 'Record low' are a complete joke when you take into account that prior to 1940 virtually half the population between the ages of 19-65 didn't work simply because they were female.
DougW659
it is math, end of message
I'm sorry people are math disabled, but this is simple math, calculated from the data and it is explained why one took October, but one can take any month and see the exact same results. Why don't you bother to understand the calculations instead of writing insults due to some data going against your beliefs.
Half-governor Palin, couldn't have mungled it better.
Or maybe you are just lazy, or 7th grade math was too much of a challenge. But I repeat myself.
You can go back 2, 3, 4 years on this blog and others and see the same stats, repeated, supportable, and trending exactly this direction.
Here's just one of many examples:
"If we compare 2011 with 1995, we see that labor force particpation has increased among all groups 50 years or older. Participation has dropped the most among the youngest Americans (16-24) and is slightly lower for all groups in-between (25-49)."
http://www.declineoftheempire.com/2012/05/the-incredible-shrinking-labor...
You suggest data is left out, yet you fail to mention that the BLS has changed who and how it counts unemployment several times over the years, so there is no real comparison. You leave out the increase in women's employment today where they are replacing men in the workforce, even as we create crappy jobs to replace the ones that used to support whole families and economies. You suggest that there is some trend in age that is imacting those not in the workforce, yet you don't take advantage of the space here to show us.
Maybe it doesn't really exist, and your post serves as an example of how to embarass oneself on the Intertubes?
Seriously, you seem to think you know better, which means that you must have at least data, or some research. This is a pretty open blog - you should feel free to create your own post and send it in. Or just select "rich text editor" below your posting box and post it your self. I can almost guarantee it will be approved.
Waiting...
Amazing there are economics trolls but there are
This post was done by a simple spreadsheet and when started, I expected to find something else, as in the increasing older population would somehow skew the labor participation rate and that's not what I found, as you can see.
So, if one wants to argue, obviously they need data analysis, mathematics, facts and we see none from this guy, a troll who managed to get an account and who is now banned.
I checked out your link and that is shocking, I have looked at disability and see no fraud or sudden increase showing up, but still these are the people to argue with who are running their numbers and know how to calculate.
My bottom line is the statistics and mathematics rule, the data rules and it says what it says. I triple checked my spreadsheet, no error.
October is most recent report, or?
Could it just be that October is the latest month available, so that by choosing this month to perform the annual comparison, the most up-to-date analysis of trend is possible? Sometimes a simple explanation is better than a theory of conspiracy.
With clinton's NAFTA and the
With clinton's NAFTA and the WTO people can't find any work.
Death by China (2012)
agreed
the american middle class has been pretty much outsourced via "FREE TRADE" agreements... i have yet to see the benefits spread to anyone except the 1%. Of course you can argue that cheaper goods is the benefit to society, but if you eventually lose the economic power to buy those ever cheaper goods that comes to naught. That line of reasoning also discount America's own history when we produced things in the US and paid living wages.
Something is strongly askew with free trade ideology and I have understand it's acceptance by so called liberal economists like Krugman and Reich, etc...
Paul Craig Roberts, a conservative, seems to be the only one left who see's the damage of FREE TRADE on the middle class.
many know the damage done by trade agreements
They just won't get any power where they could do something about it because corporations won't allow it, Elizabeth Warren being a noted exception.
You mean the "Adjusted Middle Class."
Anybody over the age of 50 can clearly see what we termed middle class during our teenage years is clearly a memory in more ways than one. Jimmy Carter said it best when he stated that today's middle class resembles the lower class of the 1970's. Want something interesting to read that explains much of this?....http://politicalgates.blogspot.com/2011/12/citigroup-plutonomy-memos-two...
Is the Fed trying to pick cherries out of season?
I don't know if this is just cherry-picking on their part, or if they are trying to spin the conversation away from the $85 billion a month being used to support the wealthy at the expense of investing in the worker, but they released a report in November "On the Causes of Declines in the Labor Force Participation Rate", in which they try to pin the low participation rate on retirement and people going on disability. One line stood out "In particular, the decline in the participation rate in the last one-and-a-half years (when the unemployment rate declined faster than expected) is entirely due to retirement".
Why pick out a particular 1.5 year period? We have been seeing the decrease since roughly 2000, coinciding with a tremendous number of jobs being disappeared or replaced with MCWalmart jobs, which would indicate that other factors, such as the selling of our jobs overseas and the massive rise in the financialization of people's lives for the profit of the wealthy are responsible for much more of the decline in the "participation rate" than retirement, forced or otherwise.
https://www.google.com/search?q=+++++On+the+Causes+of+Declines+in+the+Labor+Force+Participation+Rate+1++
It's being discussed in a lot of places, but those who want to take the side of the banksters and other criminals sure seem to place a lot more stock in it than others.
I'll stick with the above 1.5 years
1.5 years is a problem because only January has the annual population adjustment controls in it. When one takes calculations on an year or annual basis, this automatically smooths out that adjustment across a year, but if you take 1.5 years as the interval, it does not.
I think the above shows some recently is from retirement, but by calculating on 5 year increments, we can see this better.
To me, people do not retire at age 55, they do get discriminated against for jobs....a lot. So, watch their age bracket.
If the BLS asked the question, watch the sample rate and margin of error.
a note on Labor Participation Rates
There is an economist war going on with various claims on labor participation rates, accompanied by various data analysis, some where the flaws are already apparent, some with no explanation of calculations and some where currently the underlying data for statistics published cannot be found.
As a result of all of this, I'm on the hunt for this microdata claimed to be used and will eventually put together another LPR analysis piece but with moving averages and directly replying to the various analysis out there trying to claim it's all just retired etc. causing the labor participation rate implosion. Data don't lie, but statistics sure do, so i will crank them all from raw data and publish what is found with numbers, assumptions, sources,graphs and of course sarcasm. Stay tuned.
Participation Rate Factors
Robert, what are your thoughts about this recent article: "Don't Fret Over The Participation Rate"
http://seekingalpha.com/article/2565335-dont-fret-over-the-participation...
fret over participation rate
Periodically I number crunch the age brackets for labor participation rate and prove that it is not "aging demographics", although part of it is.
I have to redo this because things change over time. 2008-2010 was not age and either was 2011-2013, but age became more of a factor. Aging baby boomers.
So, unless I see accurate data analysis by age, I blow off these "opinion" pieces.