
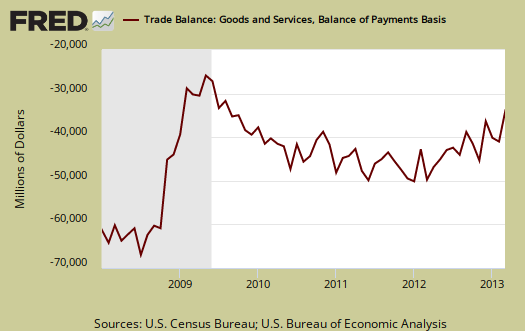
The U.S. March 2013 monthly trade deficit decreased 11% to $38.8 billion. U.S. exports decreased $1.7 billion or -0.9%. Imports declined by $6.5 billion, a -2.8% decrease. Expect an upward revision on the trade component to Q1 GDP, assuming prices were stable.
This month's trade deficit gives an annualized -4.6% change from Q1. The Q1 GDP report gives a +15.7% annualized increase in the trade deficit. While price indexes and other adjustments have not been applied, it's a safe bet to assume the trade components to GDP will be revised upward and thus Q1 GDP would be revised higher in the trade components.
Below are the goods import monthly changes, seasonally adjusted. On a Census basis, overall imports decreased by -$6.208 billion as crude oil imports plunged by -$1.919 billion. Computer imports plunged by -$1.134 billion and toys, sporting goods, games dropped another monthly -$1.044 billion.
- Industrial supplies and materials: -$1.417 billion
- Capital goods: -$1.505 billion
- Foods, feeds, and beverages: +$0.010 billion
- Automotive vehicles, parts, and engines: -$0.771 billion
- Consumer goods: -$3,406 billion
- Other goods: +$0.880 billion
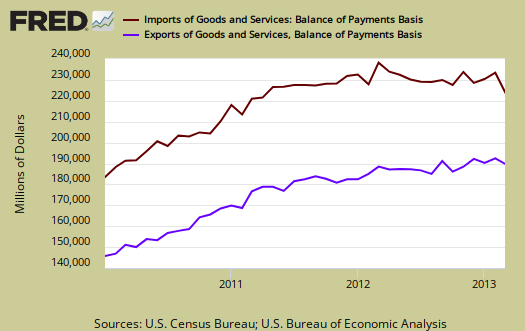
Below is the list of good export monthly changes, seasonally adjusted, by end use and on a Census accounting basis, which overall decreased by -$2.032 billion. Petroleum exports were the culprit, with a -$1.597 billion decline, although other fuels and non-monetary gold helped reduce the overall decline in industrial supplies and materials. Soy bean exports declined by -$517 million. Generally speaking declines were across the board in exports.
- Automotive vehicles, parts, and engines: -$0.331 billion
- Industrial supplies and materials: -$0.288 billion
- Foods, feeds, and beverages: -$1.052 billion
- Capital goods: -$0.269 billion
- Consumer goods: -$0.260 billion
- Other goods: +$0.169 billion
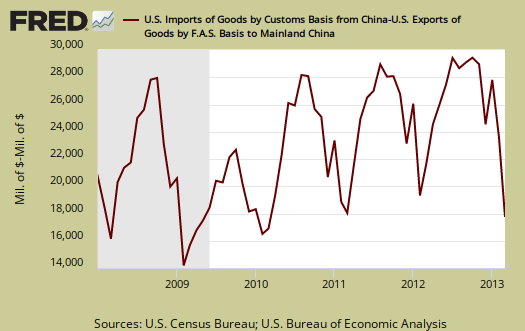
The monthly not seasonally adjusted trade deficit with China was $17.886 billion. The China trade deficit alone was 40% of the total goods deficit, not seasonally adjusted, on a Census accounting basis. The U.S. hit a new record annual 2012 $315 billion trade deficit with China. The below graph shows the not seasonally adjusted trade deficit with China, which is highly cyclical. The China Lunar New Year started February 10th, which gives a week off to workers and typical would start in January. We assume the BEA has the lunar new year as part of their seasonal adjustments, but this month's trade deficit decline had a large cheap Chinese consumer goods component, so it is possible that the timing of the 2013 lunar new year threw off seasonal adjustments.
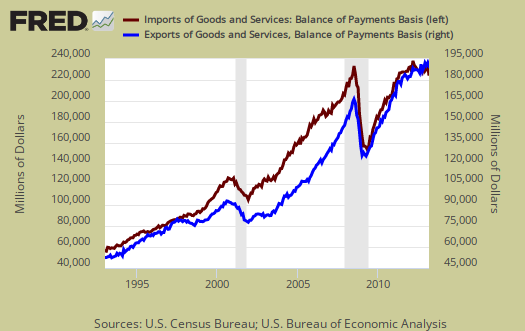
Below is another view of imports (maroon, scale on the left) against exports (blue, scale on the right). Notice the time line. Before NAFTA, 1994 we were breaking even and not running a deficit in trade. The China PNTR came into effect at the end of year 2000 and since then we are getting more trade deals passed with the claim they create jobs when America's export really is jobs. Only a global recession, as happened in 2008, caused the massive trade deficit to shrink.
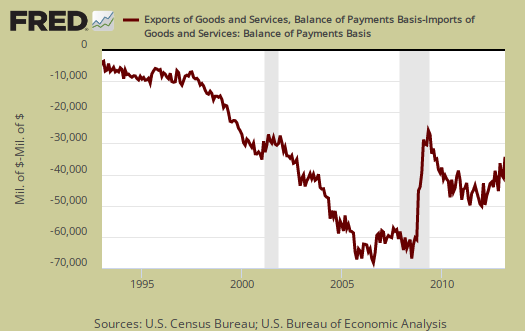
Below is another view of our trade deficit, as it grows with every trade treaty signed. The gray bars in the graph indicate recessions.
Oil or petroleum showed an end use trade deficit declined for the month by $0.4 billion to -$21.133 billion. That is a decrease of 1.5%. Petroleum related end use was 37.8% of the goods trade deficit. End use means the final use of the product and includes oil byproducts. For example, plastics are made up of petroleum, yet by their end use category, would be marked often as consumer goods.
The trade deficit in advanced technology decreased, which doesn't really mean offshore outsourcing of services has abated as this also is cyclical. The political spin is to claim only low paying, low skilled jobs are offshore outsourced. That clearly is false and amplified by a trade area which has large numbers of advanced R&D and manufacturing jobs. The below report statistics are not seasonally adjusted.
Advanced technology products exports were $27.9 billion in March and imports were $31.3 billion, resulting in a deficit of $3.4 billion. March exports were $4.9 billion more than the $23.0 billion in February, while March imports were $3.4 billion more than the $28.0 billion in February.
Here is the breakdown with major trading partners, not seasonally adjusted with the parenthesis being last month's deficit figures. China is the worst trade deficit, as detailed above. OPEC can be assumed to be oil and the OPEC nations are: Algeria, Angola, Ecuador, Iran, Iraq, Kuwait, Libya, Nigeria, Qatar, Saudi Arabia, United Arab Emirates, Venezuela.
The March figures show surpluses, in billions of dollars, with Hong Kong $3.2 ($3.3 for February), Brazil $1.7 ($1.7), Australia $1.5 ($1.3), and Singapore $1.4 ($0.9).
Deficits were recorded, in billions of dollars, with China $17.9 ($23.4), European Union $9.9 ($8.8), Japan $6.6 ($5.9), Mexico $5.3 ($4.3), Germany $5.1 ($4.5), OPEC $4.5 ($3.6), Canada $2.3 ($2.5), Ireland $2.1 ($2.2), Saudi Arabia $2.1 ($1.8), India $1.8 ($1.2), Korea $1.3 ($1.2), and Venezuela $1.3 ($1.1).
Here is the BEA website for additional U.S. trade data, such as it is. May we suggest the Census make publicly available much more data so one can compare Apples to Apples, end use, NAICS and seasonally adjusted series. In fact, please complain to your Congressional representatives, for the Census demands $300 dollars per year to access any detail in trade statistics. That's not cool, we already pay for detailed trade statistics with tax dollars.
You might ask what are these Census Basis versus Balance of Payment mentioned all over the place? The above mentions various accounting methods so we're comparing Apples to Apples and not mixing the fruit. The trade report in particular is difficult due to the mixing of these two accounting methods and additionally some data is seasonally adjusted and others are not. One cannot compare values from different accounting methods and have that comparison be valid.
In a nutshell, the Balance of Payments accounting method is where they make a bunch of adjustments to not count imports and exports twice, the military moving stuff around or miss some additions such as freight charges. The Census basis is more plain raw data the U.S. customs people hand over which is just the stuff crosses the border. 2005 chain weighted means it was overall modified for a price increase/decrease adjustment in order to remove inflation and deflation time variance. If you want just the raw data of what's coming into the country and going out, it's the Census basis and additionally the details are only reported in that accounting format. Additionally the per country data is not seasonally adjusted so watch out trying to add those numbers into the overall trade deficit. It's a statistical no-no to mix seasonal and non-seasonally adjusted numbers.
Here are other trade deficit overviews, data unrevised.
Recent comments