
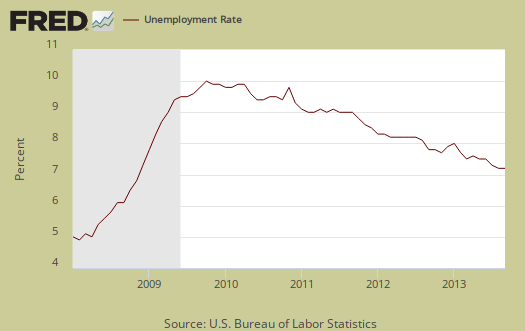
America's employment is the same as last month and we might look at the BLS report telling us, Doctor, the patient is still dead. Someone bring the crash cart for employment in America needs to be resuscitated. The BLS employment report shows the official unemployment rate declined a percentage point to 7.2%. The record low labor participation rate did not improve and neither did the record low of the employed to the civilian noninstitutional population ratio. More people dropped out of the labor force again which has been the primary driver of the official unemployment rate decreases. This article overviews and graphs the statistics from the Current Population Survey of the employment report.
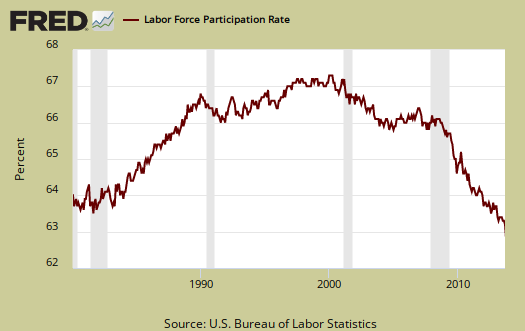
Be afraid, very afraid of the next chart. The labor participation rate is now 63.2%, mentioned above. The labor participation rate has declined -0.4 percentage points from a year ago. This implies that those who were dropped from the labor force are staying out of the labor force The -0.4 percentage point drop over a year represents about 985 thousand people who are not considered part of the labor force anymore. This implies over the past year almost a million people have dropped out out of either looking for work or have a job. For those claiming the low labor participation rate is just people retired, we proved that false by analyzing labor participation rates by age.
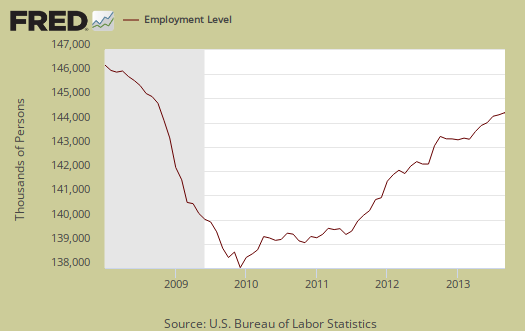
The number of employed people now numbers 144,303,000, a 133,000 monthly increase, well within the margin of error. We describe here why you shouldn't use the CPS figures on a month to month basis to determine actual job growth. These are people employed, not actual jobs. In terms of labor flows, those employed has increased 1.329 million from a year ago. The noninstitutional population has also increased by 2.396 million during the same time period, so by just the annual change in employment to population gives a ratio of 55.5%, which is terrible and well below the monthly 58.6% employment to noninstitutional civilian population ratio. The statistics from the CPS do generally vary widely from month to month, yet two million more employed per annum is not enough to correct the jobs crisis in America. An annual increase of only 1.3 million is akin to the Walking Dead showing up on your doorstep for Halloween, looking for work. Below is a graph of the Current Population Survey employed.
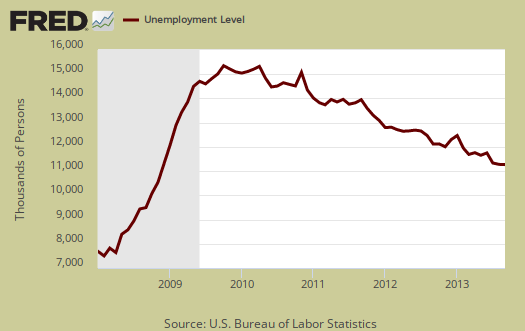
Those unemployed stands at 11,255,000, a -61 thousand decrease from last month. From a year ago those officially unemployed has declined by 827,000. This isn't a great showing, considering the 0.4 labor participation rate percentage point drop over the same period and also implies those getting the jobs might very well be new entrants into the labor force, such as foreign workers Tthe United States counts foreign guest workers in their employment statistics. This also means many people simply fell off of the BLS radar screen for being counted at all and are considered instead not in the labor force. Below is the change in unemployed and as we can see, this number also swings wildly on a month to month basis.
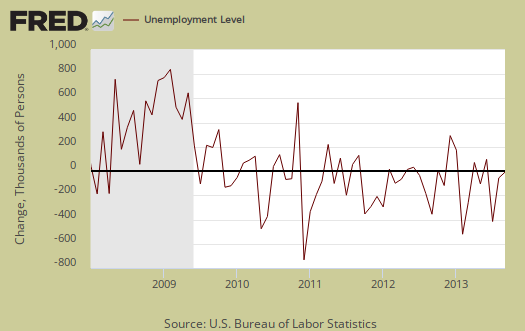
The number of people counted as unemployed, by itself, has declined by -6.8% Yet, terms of labor flows we don't see a steep slope, or strong decline in the number of unemployed and much of the recent drops are due to people dropping off the official count of those unemployed versus finding a job. Below is a graph of the unemployed.
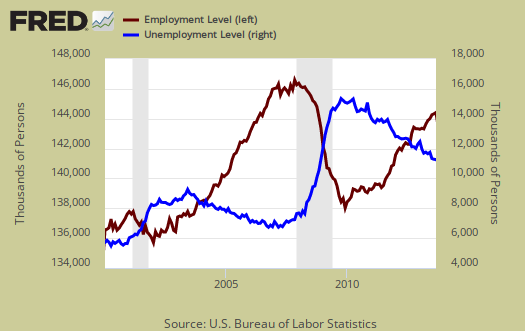
To see more labor flows, below is a graph of those considered employed, in maroon, scale on left, against those considered unemployed, in blue, scale on right, by the BLS methods. It is only recently that the growth rate of the employed has exceeded the growth rate of the unemployed (the maroon line exceeding the blue line).
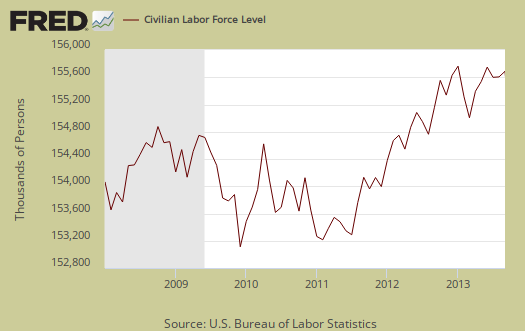
The civilian labor force, which consists of the employed and the officially unemployed, is now at 155,559,000. This is an increase of 73 thousand from last month, yet from a year ago the civilian labor force has only increased by 503 thousand. This means the civilian labor force has been flat for the last year. The BLS gives reason for unemployment and those who lost their jobs this month decreased by -126 thousand yet those who voluntarily left their job increased by 96 thousand. People reentering the labor market also increased by 52 thousand and new people into the labor market declined by -77 thousand. What this means is less people reentered the job market and less people were fired.
Notice in the civilian labor force graph below how many more people are in the labor force than at the start of the 2008 recession. Population increases every month and this post gives details on that increase, while this one describes BLS labor concepts as well as how many jobs are needed just to keep up with the increased population.
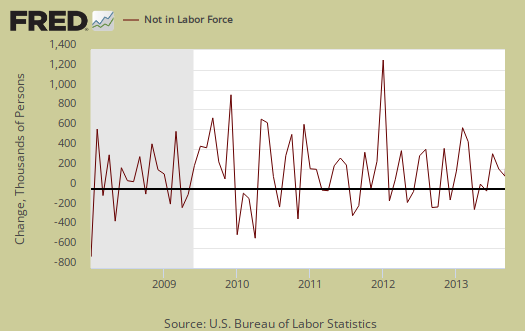
It's fairly clear the American workforce is ending up not being counted. Those not in the labor force now tallies to 90,609,000, an increase of 136,000 from last month. From a year ago, those considered not in the labor force has grown by 1.893 million. Below is the change to show on a month to month basis, the CPS shows quite a bit of variance. We talk about the wild monthly CPS changes in this post.
Yet in spite of the wild swings, as a slope, or rate of increase, those not in the labor force grew faster than the population that has the potential to work. Below is a graph of those not in the labor force, (maroon, scale on the left), against the noninstitutional civilian population (blue, scale on the right). Notice how those not in the labor force crosses the noninstitutional civilian population in growth and the accelerated growth started happening right in 2008. This cannot possibly be retirees, all at once and instead a segment of those not in the labor force simply do need work and are not being counted in the official unemployment statistics.

Below is a graph of the civilian labor force, or the official employed plus unemployed, in maroon, scale on left, against those not in the labor force, in blue, scale on right. Notice how those not in the labor force as a trend exceeded those considered employed and unemployed starting around mid 2009. It is only recently, in the past few months, where we see the reverse by trend lines, where the slopes implying growth rates are more matching. What we have seen is a never ending growing segment of the population that is considered neither employed or unemployed, i.e. not in the labor force, increasing, above the trend line of those who would be naturally dropping out, such as the retired and those in school. Not in the labor force figures do include retirees.

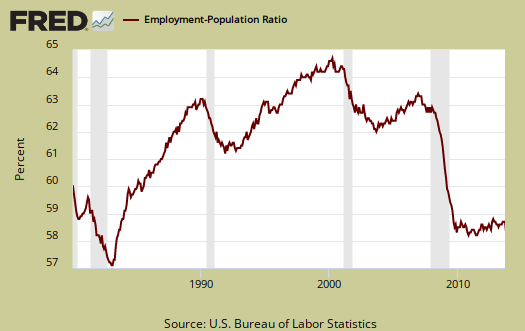
Those considered employed as a ratio to the total Civilian noninstitutional population stands at 58.6%. This ratio hasn't been hovering around 1983 record lows for years now and in 1983 there were more families with a stay at home mom, with wages high enough for only one adult to work and support a family. The low ratio implies there are many people who could be part of the labor force who are not anymore, as shown in the graph below.
Another horrific characteristic of today's labor market is the gross number of working part-time generally. There are millions of people who need full-time jobs with benefits who can't get decent career oriented positions. Those forced into part time work is now 7,926,000, an increase of 15,000 from last month. Those stuck in part-time has declined by -681 thousand from a year ago, While the decline might seem like a recent improvement, it's not. The below graph shows levels of people who could only get part time hours have remained elevated and the reason for the annual decline is due to September 2012's unusual increase, an average of half a million above trend for just that month.

There are two categories of those working part-time hours. Those who could only get part-time jobs and those working who got their hours cut due to businesses not having enough work for them. The number of people who could only get part-time work decreased by -162 thousand to 2,557,000. The number of people who could only find part-time work has been fairly static and high as shown in the below graph.

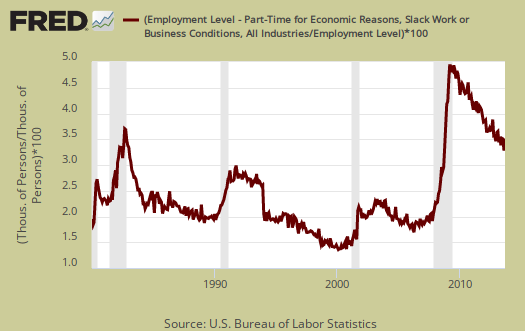
Below is a graph of forced into part-time work because they got their hours cut, as a percentage of the total employed. Part-time work due to cut hours is known as slack work conditions and consisted of 4,960,000 people, a incline of 152,000 from last month. Slack working conditions causing part-time hours still amazingly high, and implies economic conditions have not improved enough. Below is a graph of forced part-timers due to slack work conditions as a percentage of the civilian labor force. This is a recession economic indicator. Notice the line slope matches strongly the gray recession bars of the graph.
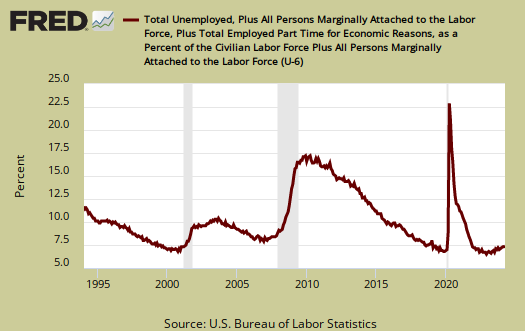
U-6 is a broader measure of unemployment and includes the official unemployed, people working part-time hours because that's all they can get and a subgroup not counted in the labor force but are available for work and looked in the last 12 months. Believe this or not, the U-6 alternative unemployment rate still leaves out some people wanting a job who are not considered part of the labor force. U-6 dropped -0.1 percentage points to 13.6%. This month's drop in the U-6 figurewas due to the official unemployment rate decline.
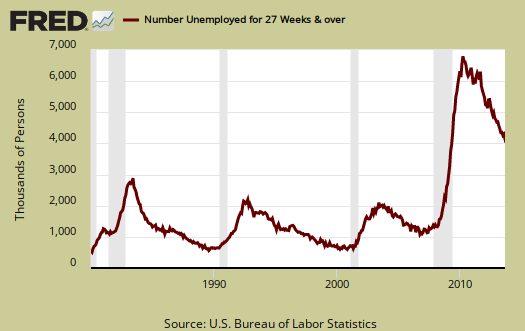
The long term unemployed, or those unemployed for 27 weeks and over, stands at 4,146,000 people. This is an decline of -144,000 from last month. The long term unemployed are the crisis of our time and this figure decrease does not necessarily imply those unemployed for a long time are actually finding jobs. The long term unemployed have declined by -725 thousand from a year ago, yet we believe this is due to people no longer counted versus all of those thousands finding work
The marginally attached are people not in the labor force because they have not looked for a job in the last month, but have looked for a job in the last year. This number has ballooned since 2007 and not returned to pre-recession levels. The graph below is the number of people considered marginally attached to the labor force, currently at 2.302 million. Those marginally attached has declined by -215 thousand from a year ago.
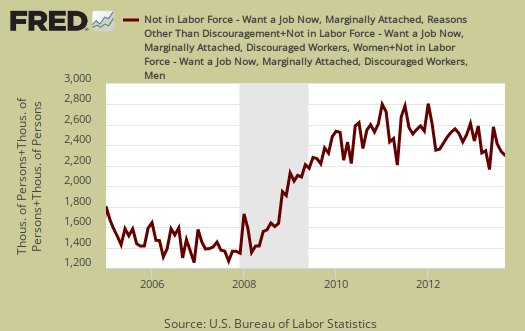
Discouraged workers are people, not counted as part of the civilian labor force, who not only want a job, but also looked for one in the last year. These people aren't job hunting now because they believe there are no jobs out there. Below is the graph of discouraged workers, currently at 852,000 people and are a subset of the marginally attached. Discouraged workers is kind of a barometer for how the job market is perceived and has increased by 50,000 people from a year ago.

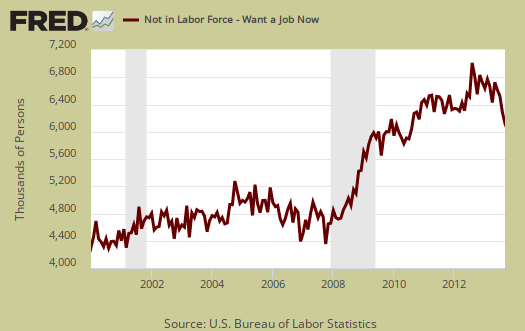
Our favorite statistic from the CPS survey is how many people who are considered not in the labor force, report they want a job now. It is a direct survey question from the CPS. The survey asks people who are not being counted in the unemployment statistics and official unemployment rate if they want a job. The number who answer yes currently stands at 6,163,000. A year ago this figure was 6,718,000. While this figure has decreased by 555 thousand, there are an astounding number of people not counted who report they actually want a job and 1.5 million higher than before the recession. This figure includes the discouraged workers and marginally attached, but is seasonally adjusted, unlike the above.
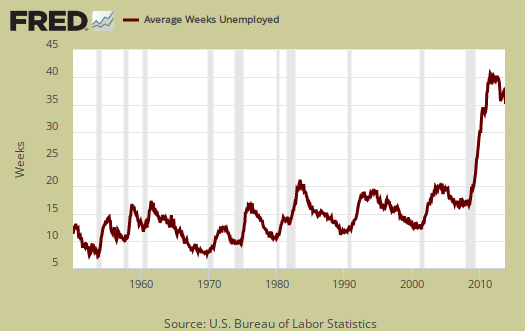
The average length of unemployment is now 36.9 weeks, not much change from last month . The average duration is so high due to the long-term unemployed who represent 36.9% of the unemployed. Many face age discrimination as well as discrimination for the fact they need a job, one of the worst injustices in America.
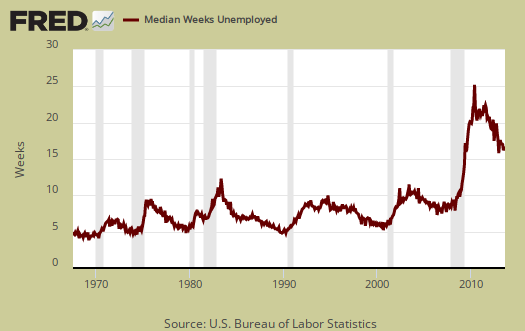
The median time one is unemployed, which means 50% of people have gotten a job in this amount of time, and is 16.3 weeks and also did not change much from last month. This is over four months to be without a paycheck as the median, it's quite high.
Those unemployed less than five weeks saw a 33 thousand increase from last month. Those unemployed between five weeks and 14 weeks decreased by -63 thousand and people who had been unemployed for 14 weeks to 26 weeks increased by 110,000. As previously noted, the long term unemployed decreased by -144 thousand. . A drop in the unemployed does not necessarily mean they found a job.
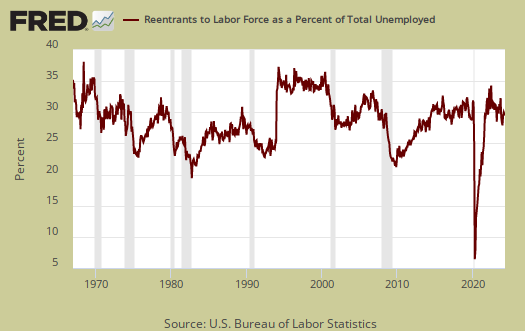
People join the ranks of the unemployed because they were laid-off, fired, they quit, the job was temporary and thus ended, they entered the labor force for the first time and re-entrants. Re-entrants are people with work experience, yet have been considered not in the labor force for some time. Recall to be considered unemployed one has to be actively searching for a job. Re-entrants increased by 52 thousand people this month. Below are re-entrants as a percentage of the total unemployed. As you can see, as jobs and opportunities appear, people re-enter the labor force looking to snap one of those jobs. Considering the massive damage still to the U.S. job market, the below tells us things really have not improved enough. If there were really a lot of job opportunities out there, the slope of this graph would spike up and should spike up to the extremes since there are so many who have stopped looking, are not counted as unemployed currently.
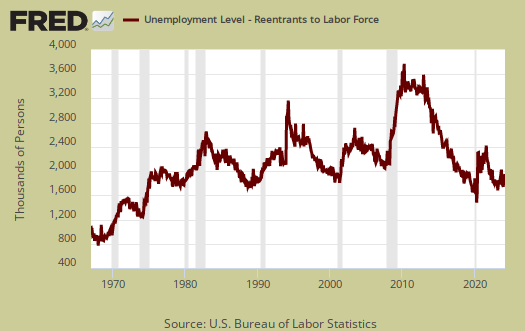
If one looks at the levels of re-entrants, or people considered not in the labor force who started actively looking for a job again, the levels are at all time highs. This is yet another sign on how people are not finding work, giving up, then dropping out of the labor force and then trying again to get a job. If the job market was good, we would see the levels of re-entrants start to decline by now, as they would have found work instead of being once again officially counted as unemployed.
Here is our overview of last month's CPS unemployment statistics.
Recent comments