
The BLS employment report shows the unemployment rate ticked down by 0.2 percentage points to 7.7%. The reason for the unemployment rate decrease is less people participated in the labor force in November. Superstorm Sandy had little effect on the monthly employment figures. This article overviews the statistics from the Current Population Survey of the employment report.

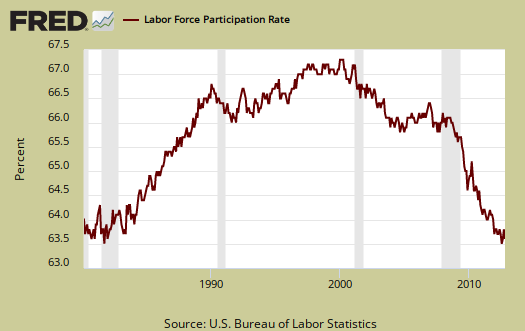
The labor participation rate decreased -0.2 percentage points to 63.6%. Less people in the labor force is the reason the unemployment rate decreased. The labor participation rate is at artificial lows, where people needing a job are not being counted. For those claiming the low labor participation rate is just people retired, we proved that false by analyzing labor participation rates by age.
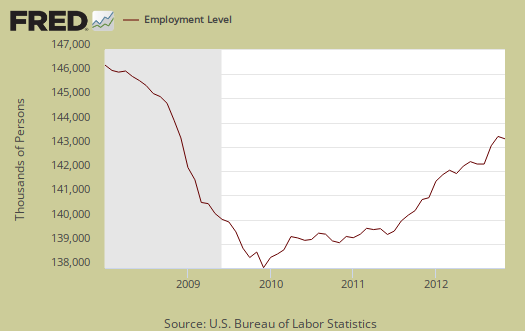
The number of employed decreased by -122,000 in a month to a total of 143,262,000 employed people in the U.S. Below is a graph of the Current Population Survey employed.
Those unemployed decreased by -229,000 to a new level of 12,029,000. Below is the change in unemployed and as we can see, this number swings wildly on a month to month basis, as we describe here and why you shouldn't use the CPS figures on a month to month basis to determine jobs.

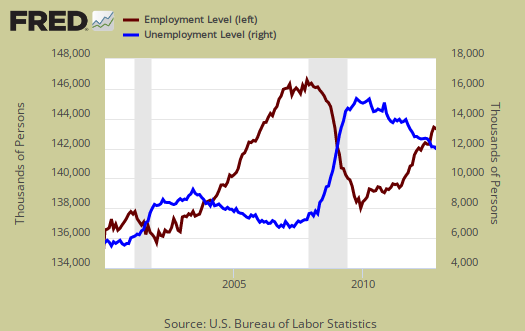
Below is a graph of those considered employed, in maroon, scale on left, against those considered unemployed, in blue, scale on right, by the BLS methods. We can see, it's only recently that the growth rate of the employed has exceeded the growth rate of the unemployed.
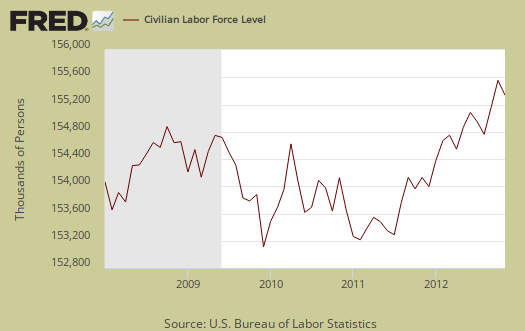
The civilian labor force also dropped by -350,000 to 155,291,000. Notice in the graph below how many more people are in the labor force than at the start of the 2008 recession. Population increases every month and this post gives details on that increase, while this one describes BLS labor concepts as well as how many jobs are needed just to keep up with the increased population.
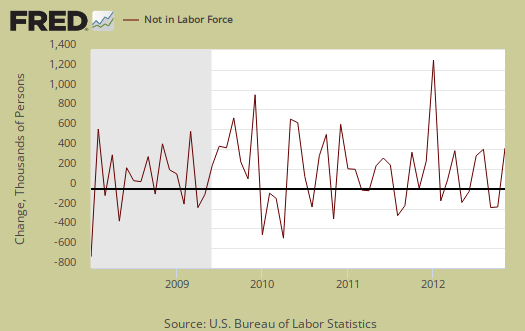
Those not in the labor force jumped by 542,000 to 88,883,000. Below is the change to show on a month to month basis, the CPS shows quite a bit of variance. We talk about the wild monthly CPS changes in this post.
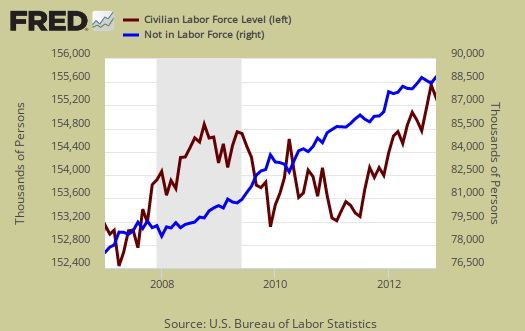
Below is a graph of the civilian labor force, in maroon, scale on left, against those not in the labor force, in blue, scale on right. What we see is a never ending growing segment of the population that is considered neither employed or unemployed.
Those considered employed as a ratio to the total Civilian noninstitutional population decreased by -0.1 percentage points to stand at 58.7%. Below is a graph since 1980 to show how low this ratio is.
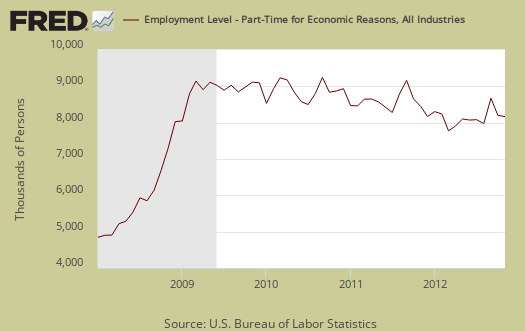
A huge problem with today's labor market is the gross number of working part-time generally. There is a huge number of people who need full-time jobs with benefits who can't get decent career oriented positions. Those forced into part time work decreased by -168 thousand to 8,176,000. While still a hell of a lot of people stuck with part-time hours who need full-time work, a decrease in this figure over time is better news for labor.
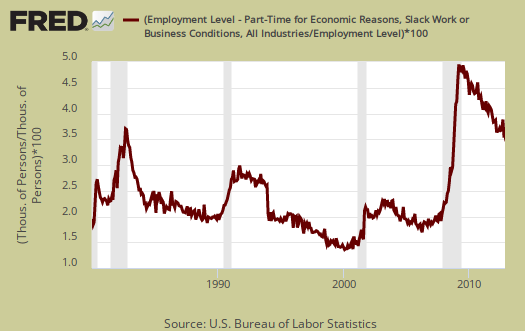
Below is a graph of forced into part-time because they got their hours cut as a percentage of the total employed. This is known as slack work conditions and dropped by -114,000 people in November. Below is a graph of forced part-timers due to slack work conditions as a percentage of the civilian labor force. We think this graph is a recession economic indicator, and notice the slope matches strongly the gray recession bars of the graph. The percentage of people in working part-time due to slack economic conditions has stayed extremely high since the start of the Great Recession, even while declining the last two months.
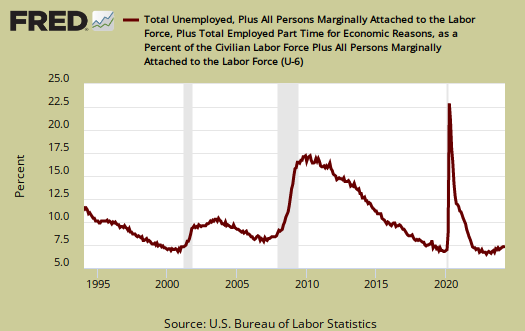
U-6 is a broader measure of unemployment and includes the official unemployed, people working part-time hours because that's all they can get and a subgroup not counted in the labor force but are available for work and looked in the last 12 months. Believe this or not, the U-6 alternative unemployment rate still leaves out some people wanting a job who are not considered part of the labor force. U-6 ticked down -0.2 percentage points to 14.4%.
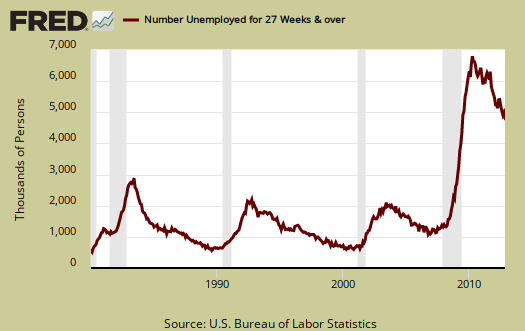
The long term unemployed, or those unemployed for 27 weeks and over, declined by -216 thousand to a still astounding 4,786,000 people. The long term unemployed are the crisis of our time and this figure just isn't decreasing and they are getting hired. The long term unemployed are 40.1% of the total unemployed, a -0.5 percentage point decline from last month. The question is are these people no longer counted or did they find a job. We think the former is more probable.
The marginally attached are people not in the labor force because they have not looked for a job in the last month, but have looked for a job in the last year. This number has ballooned since 2007 and not returned to pre-recession levels. The graph below is the number of people considered marginally attached to the labor force, currently at 2.505 million.
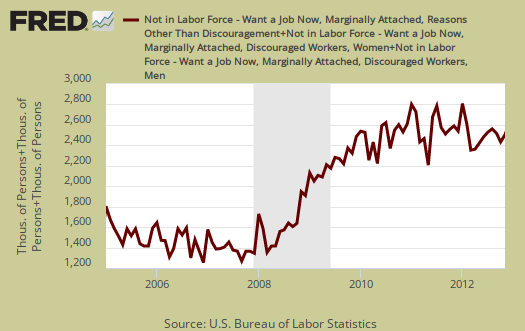
Discouraged workers are people, not counted as part of the civilian labor force, who not only want a job, but also looked for one in the last year. These people aren't job hunting now because they believe there are no jobs out there. Below is the graph of discouraged workers, currently at 979 thousand and are a subset of the marginally attached.

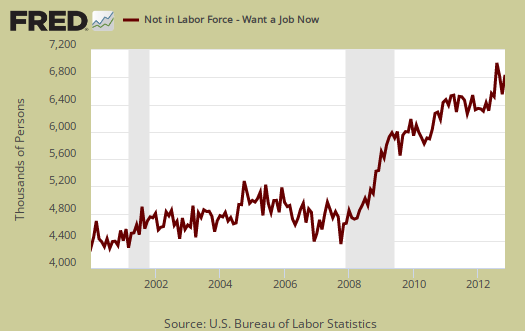
One of our favorite statistics from the CPS survey is how many people who are considered not in the labor force, want a job now. It is a direct survey question from the CPS. The survey asks people who are not being counted in the unemployment statistics and official unemployment rate if they want a job. The number who answered yes currently stands at 6,817,000 and increased 230 thousand from last month. That's an astounding number of people not counted who report they actually want a job. This figure includes the discouraged workers and marginally attached, graphed above.
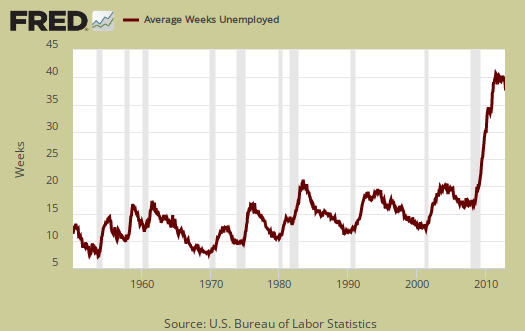
The average length of unemployment decreased from 40.2 weeks to 40.0 weeks, which is a negative sign, just absurdly long to be unemployed. The average duration is also so high due to the long-term unemployed.
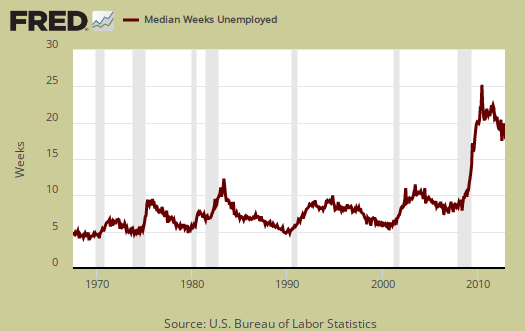
The median time one is unemployed, which means 50% of people have gotten a job in this amount of time, and decreased significantly from 19.6 to 19.0 weeks.
Here is last month's overview of the CPS unemployment statistics. We'll be reviewing payrolls and other employment figures in additional articles.
duration of employment numbers dont add up
it appears that the number of those jobless more than 27 weeks declined by a seasonally adjusted 216,000, from 5,002,000 in October to 4,786,000 in November; however, since those unemployed less than 5 weeks, 5 to 14 weeks, and 15 to 27 weeks also declined by an additional 176,000, the duration of employment numbers dont add up to the 229,000 less unemployed reported by the household survey...
http://www.bls.gov/news.release/empsit.t12.htm
http://www.bls.gov/news.release/empsit.a.htm
what am i missing here?
why duration of employment doesn't add to total unemployed
If we add up, from table A. the unemployed by duration of time, we get -392,000. Yet also from table A, the unemployed only dropped -229,000. What happened?
The first thing to know is these are separate series. The total unemployed are aggregate figures from 4 separate series and then are seasonally adjusted after aggregation.
The unemployed by duration are separate survey questions and data series and they are also seasonally adjusted as their own separate survey responses.
So, they don't always add.
When one looks at duration it often will not add to the drop in those unemployed. The reason is some moved from different time periods, i.e. those unemployed less than 5 weeks moved to those unemployed 5-14 weeks. Then some did obtain jobs, but others dropped out of the labor force and are no longer counted as employed or unemployed. They may have worked a short temporary job in the reference week, hence moved from long term unemployed to < 5 weeks doing some very short temporary job.
If one notices the civilian labor force overall dropped by the total employed and unemployed., -350,000. Yet if one notices those "not in the labor force" increased by the same amount as the drop in employed, unemployed and the growth in the civilian noninstitutional population, or 542,000.
So, the survey askes 60,000 households each month and those figures are then extrapolated to apply to the total U.S. population. In the CPS, the total unemployment and unemployment series are aggregated by independently adjusted components.
Since you are referencing the tables, if you pull up the complete report, also linked here at the top of this article then go down to about page 10, after table A and B
you will see "technical note" and then look under Seasonal adjustment and that's why these figures do not add.
Additionally, there is a funky little fact. If you look at part-time in the tables, that doesn't add up to table A either and the reason is one is asking is your job part-time while the other is asking did you work part-time hours in the survey reference week.
Good eye! The BLS employment report as are many government statistics are little mini jigsaw puzzles, it can get tricky and at least you're reading their statistical release!