
A flurry of studies have been released telling us what we already know. America is not the land of opportunity for most folk.
Social mobility is the ability to rise or fall economically in relation to one's peers. Increased social mobility implies people get ahead by their own efforts.
There are two forms of mobility, absolute mobility and relative. Absolute mobility asks do you have more money than your parents in comparable dollars. Relative mobility is the ability to move out of poverty and to the middle class or conversely, from a life of privilege and into the middle class. Relative mobility means if one is raised in poverty, with dysfunctional parents or even with a silver spoon, what are the odds that person will be in similar economic circumstances as an adult.
The Pew Charitable Trust discovered unfortunately in America, more and more destinies are determined by birth.
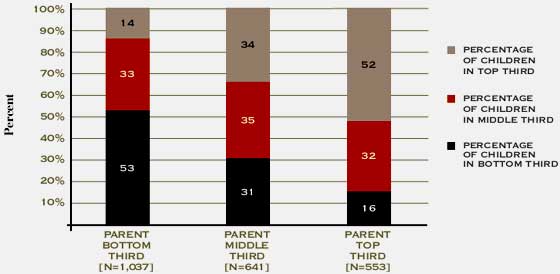
What Pew found is 53% of kids who parents were in the income distribution bottom third remained there as adults. In other words if you were born poor, odds are you remained poor. 52% of children born into the top third of family income distribution stayed in the top third income bracket as adults. In other words, if you were born rich, you stayed rich.
From the Pew Economic Mobility Project, here is the meat of their findings.
Regardless of family structure and race, our study suggests a considerable amount of absolute mobility in the United States. Approximately four out of five children have higher total family incomes than their parents, once income is adjusted for family size, with there being greater levels of absolute mobility among lower-income children.
However, African American children who grew up in the bottom or middle of the parental income distribution are much less likely than white children to have greater economic success than their parents.
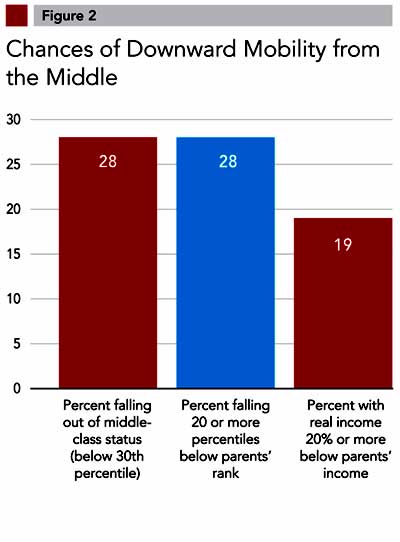
In terms of relative mobility, 50 percent of children with parents in the lower third of the income distribution remain there, while the majority of children who grew up in relatively wealthy families remain there. Less than one in five children in the bottom of the parental distribution will eventually reach the top of the child distribution, and less than one in five will fall from the top of the parental income distribution to the bottom of their own distribution.
There is substantially less upward mobility in relative terms among African American children than among white children. Two-thirds of African American children who grew up in the bottom of the income distribution remain there.
It gets much worse for single moms. We saw earlier single mothers are having a hell of a time economically, with a huge percentage of single mothers living in poverty and half of the kids living in poverty have single moms. Thanks Dad, you're such a responsible sot. About 25% of all kids are growing up poverty stricken.
The New York Times overviewed five different studies all showing the same thing, pulling yourself up through hard work and opportunity in America is disappearing.
At least five large studies in recent years have found the United States to be less mobile than comparable nations. A project led by Markus Jantti, an economist at a Swedish university, found that 42 percent of American men raised in the bottom fifth of incomes stay there as adults. That shows a level of persistent disadvantage much higher than in Denmark (25 percent) and Britain (30 percent) — a country famous for its class constraints.
Meanwhile, just 8 percent of American men at the bottom rose to the top fifth. That compares with 12 percent of the British and 14 percent of the Danes.
Despite frequent references to the United States as a classless society, about 62 percent of Americans (male and female) raised in the top fifth of incomes stay in the top two-fifths, according to research by the Economic Mobility Project of the Pew Charitable Trusts. Similarly, 65 percent born in the bottom fifth stay in the bottom two-fifths.
Pew also found one third of kids born into the middle class from the 1960's just fell down the economic ladder as adults.
More shock and awe, the study statistics and data are from before this recession.
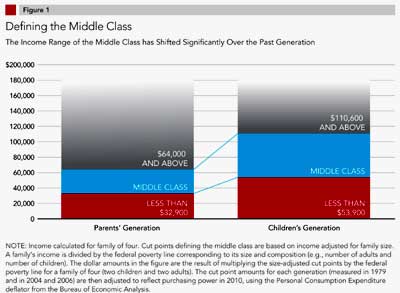
Pew looked at children born in the early- to mid-1960s and assessed their economic status roughly 40 years later.
Being middle class in the parents' generation meant a household income of roughly $33,000 to $64,000 in 1979. But their children had to earn between $54,000 and $111,000 to maintain their relative standing in society in the mid-2000s. (These figures are adjusted for inflation.)
The middle class is defined as those between the 30th and 70th income percentile.
Marital status and educational attainment had a great bearing on whether people were able to remain in the middle class, Pew found. Race and gender were also factors.
Those who are divorced, widowed or separated are more likely to fall out of the middle class, particularly if they are women. And Americans who don't attend college are also more likely to slip.
One's foothold on the middle class is more secure if you are a white man. Thirty percent of white women and 38% of black men drop out of the middle class, while only 21% of white men do.
Below is the Pew Charitable Trust chart of what income levels define the classes. See if you're dropped off the social mobility ladder.
We all know college can help one stay alive financially, or that is the continual drum beat. Pew also found a scary consequence of the housing bust. It seems many families were using home equity loans to pay for college. That of course has dried up.
Pew has an entire website, Economic Mobility, devoted to publishing their reports, facts and figures.
Bottom line once again we're seeing another American Dream Myth dying a tragic death.
Comments
great article. I'm just
great article. I'm just confused on the first chart. How three different classes black, red and grey add up to 100%? They are stacked up by the bottom, middle and top third. Is it a pure coincidence or a diagram made to belive?
graph 1 from Pew
I agree it is confusing and it was one of their best charts. Ok. The columns represent the parent's economic class, then the colors represent the percentage of their offspring who are in that class.
So, taking column one, you see the children of people in the bottom 3rd income brackets, the black, stayed in that income bracket as adults or 53%.
Of rich kids who moved into the bottom third income bracket as adults, is 14%. 33% or a third of kids born into the middle class moved into the bottom income bracket as adults.
That's column one and you apply the same thing to column two and three.
The column position represents the adults and the colored sections represent the kids. If they are black, the kids came from the bottom third income bracket, if they are light brown, they came from the top income bracket, red is the middle class.
Hope that helps. You might also click on any of the links and read the Pew actual report, they have many graphs and more information. This site has a tendency not to focus on demographics, but some of the information is truly depressing. i.e. what the hell is going on with black men and having babies out of wedlock. Poverty I suspect but the stats are not good.