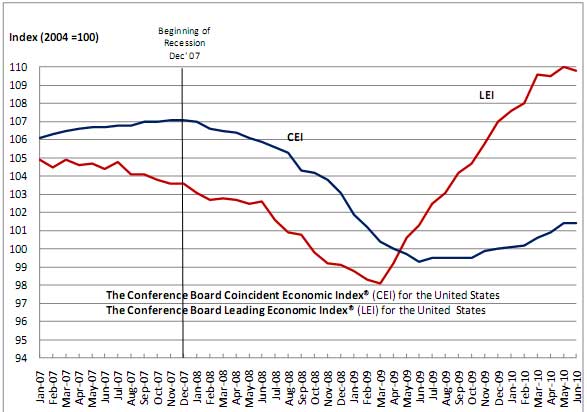
The conference board leading economic indicator (LEI) index dropped -0.2% for June. May was a +0.5% increase and April was a-0.1% decrease.
Below is their graph from the report, with both LEI and the coincident index, which was unchanged from May. The Conference Board's lagging economic indicator index increased +0.1% in June.
Unfortunately (at least in a press release), the Conference board does not give the formula or weighting of this index. The elements are Average weekly hours, manufacturing, Average weekly initial claims for unemployment insurance, Manufacturers’ new orders, consumer goods and materials, Index of supplier deliveries – vendor performance, Manufacturers' new orders, nondefense capital goods, Building permits, new private housing units, Stock prices of 500 common stocks, M2 of the Money supply, Interest rate spread, 10-year Treasury bonds less federal funds and the Index of consumer expectations.
As one can see there are some elements completely divorced at this point from the real economy, such as corporate quarterly profits and stock values.
The Philadelphia Fed also released state coincident indexes.

Recent comments