An agreement between Russia and a handful of OPEC countries to freeze oil production pretty much dominated most of the news out of the oil patch this past week. In a well publicized ‘secret’ meeting between Saudi oil minister Ali al-Naimi and Russian energy minister Alexander Novak in Doha on Tuesday, they agreed that they would freeze their oil output at current levels if other large producers would also agree to do so. Since Russia had closed out the year with their oil production at record levels and Saudi output has remained near its August record high, their agreement in effect was to not make the glut worse by producing more, and not any indication of a production cutback. Qatar and Venezuela, who instigated the meeting, also agreed to participate under the same terms, though neither seemed to be on the cusp of an output increase anyway. Although the US markets were closed for holiday on Monday, rumors of the meeting drove oil futures 1.1% higher to $30.15 a barrel in off market electronic trading, a rally which persisted briefly on Tuesday until traders realized that not much was likely to come of the agreement, sending oil down nearly 4% to close at $29.04 a barrel on Tuesday as hopes for an end to the glut faded.
Still, since Ali al-Naimi, who has been CEO of Saudi Aramco since 1983 and the face of OPEC since the mid 1990s, was personally involved, we have to consider this as a serious attempt to get on top of the oil glut, as unlikely as it is to produce a binding agreement. Although Iran welcomed the agreement to freeze oil production, they clearly wont do so themselves, believing the glut was caused by others who ramped up production while western sanctions forced them to curtail theirs; Iran is still expected to increase their production from last year's 2.8 million barrels per day to 3.3 million b/d by the end of 2016 and to 3.7 million b/d at the end of 2017.. Initially, the United Arab Emirates’ energy minister refused to discuss a cap to crude oil production, but by Thursday,the UAE had indicated their willingness to go along and Iraq also indicated it is open to freezing its oil production at January levels if big producers inside and outside of OPEC would do the same. With these large producers on board, US oil prices traded above $31 a barrel on Thursday before closing at $30.77 a barrel. Still, OPEC members have historically cheated on such quotas, and even Russia said that even if the production freeze is agreed to, Russia would still be allowed to increase output by the rules laid out at Doha. So, with record oil inventories weighing on the market, oil prices fell back to close the week at $29.64 a barrel, just 20 cents higher than a week earlier...
One other piece of news we ought to mention before we move on to this week's reports was a new report published Tuesday by the auditing and analytics firm Deloitte that forecast more than a third of oil producers are at high risk of bankruptcy this year, as low oil prices propagate further losses and simultaneously restrict their ability to raise additional cash to pay their debts, which most of them have been able to do this past year. Deloitte looked at more than 500 oil and natural gas exploration and production companies worldwide and found that 175 of them, which have a combined total of more than $150 billion in debt, are likely to be heading for bankruptcy restructuring unless oil prices recover sharply. That would be an unprecedented number of failures, according to John England, vice chairman of Deloitte, who told the financial times "We could see E&P bankruptcies surpass Great Recession levels as companies struggle to remain solvent"
As we mentioned last week, at least 67 U.S. oil and natural gas companies already filed for bankruptcy in 2015 and five more filed in January. This week saw Paragon Offshore, a Texas operator of drilling rigs from the Gulf of Mexico to the North Sea, file for Chapter 11 bankruptcy protection, and saw both Energy XXI Ltd. and SandRidge Energy miss interest payments. The rest of the excrement could hit the fan as soon as next month; a Bloomberg study of 61 shale companies in their index of North American independent oil and gas producers found that the industry must come up with $1.2 billion in interest payments by the end of March, or go to court to explain why the did not. Chesapeake Energy, the operator of more than half of Ohio's wells, is certainly one we expect to see seek protection soon; last week we mistakenly thought their report was due this week, but as it turns out, it wont be out until the 24th. By then, we should know how the rest of the frackers have done in the 4th quarter, so we'll take a look at their prospects for survival next week, once we have all the reports in hand.
New Records for Gasoline and Crude Oil Stores, and Why Oil Output is Holding Up
This week's stats from the US Energy Information Administration, delayed until Thursday because of the Monday holiday, showed that our supplies of crude oil and gasoline in storage have again both risen to new record levels, as our oil imports rose, our oil production slipped, and refineries increased their consumption of crude for the first time this year. As usual, the major reason for the increase in oil inventories this week was a big jump in our imports of crude oil, which rose by 795,000 barrels per day to average 7,919,000 barrels per day during the week ending February 12th, up from an average of 7,124,000 barrels per day during the week ending February 5th. While that was 11.5% higher than the 7,105,000 barrels per day of oil we imported during the 2nd week of February a year ago, oil imports are notoriously volatile week to week (as one VLCC tanker can be carrying more than 2 million barrels), so the EIA's weekly Petroleum Status Report (62 pp pdf) reports imports as a 4 week moving average. That EIA report showed that our crude oil imports averaged over 7.7 million barrels per day over the last 4 weeks, 5.8% above the same four-week period last year.
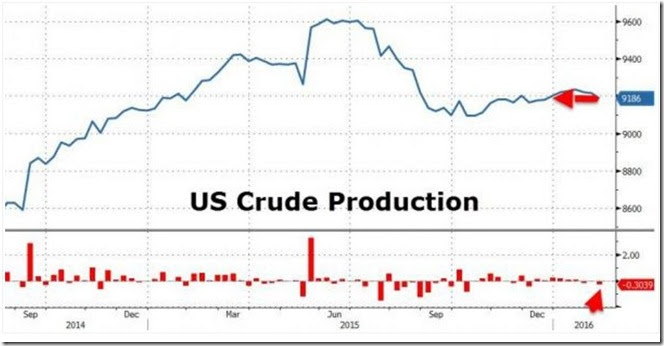
At the same time, EIA data showed our field production of crude oil fell by 51,000 barrels per day, from 9,186,000 barrels per day during the week ending February 5th to 9,135,000 barrels per day during the week ending February 12th. That was our largest drop in crude output since the second week of October and leaves our crude production 1.6% below the 9,280,000 barrels per day we were producing in the second week of February last year, although it remains on a par with the oil production figures we saw in September and October. Recall that last week we showed long and short terms graphs of our oil production, which showed that our domestic oil production rose from around 5 million barrels per day before fracking, to top 9 million barrels per day last November, where it has held fairly steady since, despite the fact that the number of new wells being drilled has dropped by more than 70%. This week a series of graphs from the EIA were posted at several oil sites around the web which go a long way to explain that apparent anomaly, so we'll include them here and explain what they mean.
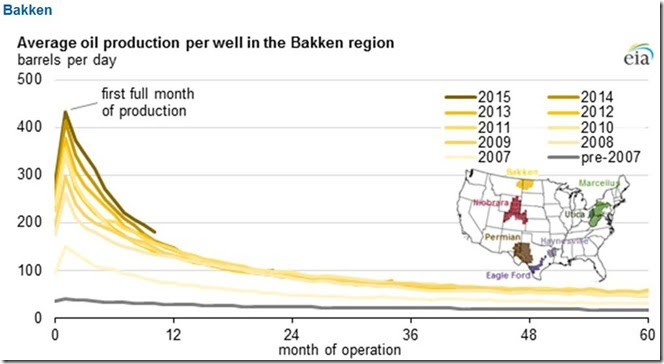
Bakken crude oil output per well daily by month of production:
The above graphic, and the three below, all come from the EIA's monthly Drilling Productivity Report, and they are all constructed in the same manner. Each graph has 10 production graph lines within it, one for each year since 2007, and a grey line for pre-2007 production, for each of the major 4 oil producing basins tracked monthly by the EIA. Each annual line then shows the average production of fracked wells for that given year for each month that oil wells started that year have been in operation. Thus in the graphic above for the Bakken, the lightest yellow line shows the average production record of all Bakken wells that were fracked and began producing oil in 2007. Following along that line, we can see that in the first month 2007 wells began to produce, their output averaged 150 barrels of oil per day; by the time the 2007 wells were 12 months old, their production dropped to 75 barrels per day, and by the time they were 24 months old, their production had slipped to 50 barrels per day. When we go out to the end of that light yellow 2007 line, we see that production of those 2007 wells had slipped to 30 barrels per day by the 60th month of operation, and presumably continues to deplete further to this day...(NB: my numbers are estimates; the data was not supplied)
If we then look at the 2008 line, we see considerable improvement from 2007; wells started that year produced 250 barrels per day the first month, were still producing 125 barrels per day by the 12th month, 80 barrels per day in the 24th month, and were still producing nearly 50 barrels per day after 5 years had passed. Production per newly fracked Bakken well then got incrementally better each year until 2015, when new wells were producing 440 barrels per day when first fracked, and still around 180 barrels per day 10 months later. So with that introduction to what these graphs show us, we'll include the similar graphs for each of the other major producing shale basins below, and then see what we can glean from them about the past year's - and future - oil production..
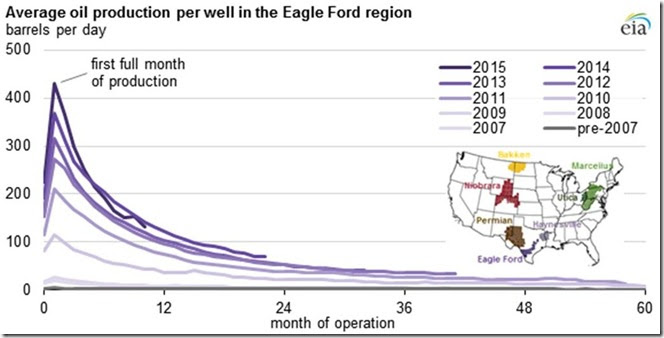
Eagle Ford crude oil output per well daily by month of production:
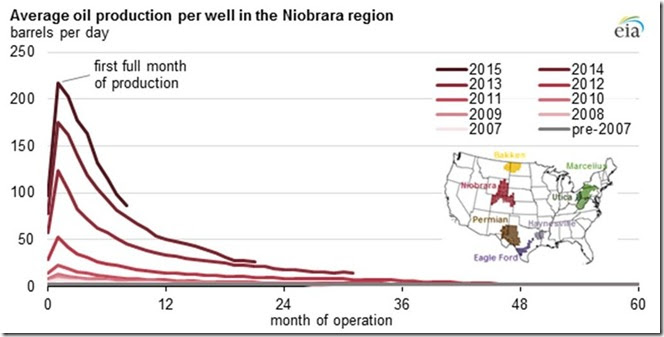
Niobrara crude oil output per well daily by month of production:
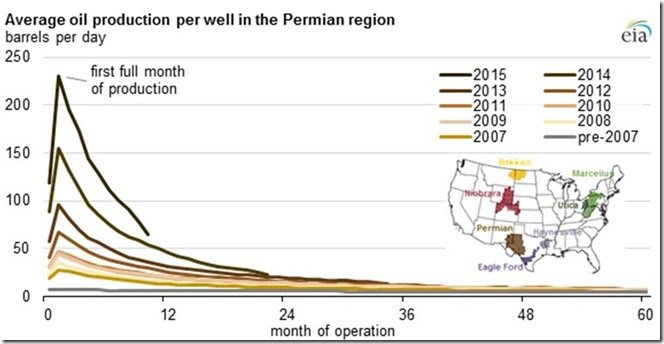
Permian crude oil output per well daily by month of production:
One observation that should be immediately obvious from just glancing at this set of charts is that the new wells that started producing this year have been more productive, sometimes considerably so, than the ones that started producing in 2014, which were in turn more productive than those fracked in 2013. For instance, the first month of production for 2013 wells in the Bakken was 320 barrels per day, it was then about 370 barrels per day for wells completed in 2014, and then rose to 440 barrels per day for wells brought on in 2015. For the Eagle Ford, the first month yielded an average of 320 barrels per day for 2013 wells, 370 barrels per day for 2014 wells, and 420 barrels per day for last year’s wells. For the Niobrara, the first month yielded a 125 barrels per day average for 2013 wells, 170 barrels per day for 2014 wells, and 220 barrels per day for 2015 wells, and for the Permian, charted directly above, the first month averaged less than 100 barrels per day for 2013 wells, rose to 155 barrels per day for 2014 wells, and 230 barrels per day for wells completed last year. The reasons for the increases vary; crews are becoming more experienced at what they need to do to get an optimum yield, efficiencies in the methods continue to be introduced, and many frackers are now drilling and fracking longer laterals, obviously increasing the area fracked and hence the wells output. But what is pretty clear is that for these 4 major basins, less producing wells have been producing more, thus maintaining their total level of output...
Since about 5 million barrels per day of our national 9 million plus barrels per day oil production is now from horizontally drilled and fracked wells, this increased production from each well that's brought on goes a long in explaining why our oil output has not fallen off more, despite the drop in the number of rigs actually drilling for oil from 1609 in October of 2014 to under 450 working rigs recently. Every well that went into production this year was producing much more than the ones from prior years which were being slowly depleted. Considering the fact that since the fracking operation, which initiates the oil flow, costs twice to three times as much as drilling the well, many companies actively manage their inventory of drilled wells and hold off on fracking until they can contract to sell the expected oil production at a suitable prices. A recent NY Times article puts the number of such drilled but uncompleted (DUCs) wells at 4,000 nationally, a figure consistent with other reports on DUCs i've seen from industry sources (ie, a December Rigzone article put the number of DUCs in the Permain alone at 2000). The same NY Times article, focusing on Anadarko, says they began warehousing DUC wells and effectively storing oil underground since late 2014, when prices started tanking. It's reasonable to assume that other oil producers did the same; after all, who would want to blow the first few (& best) months of your fracked well production when oil prices have just gone in the tank?
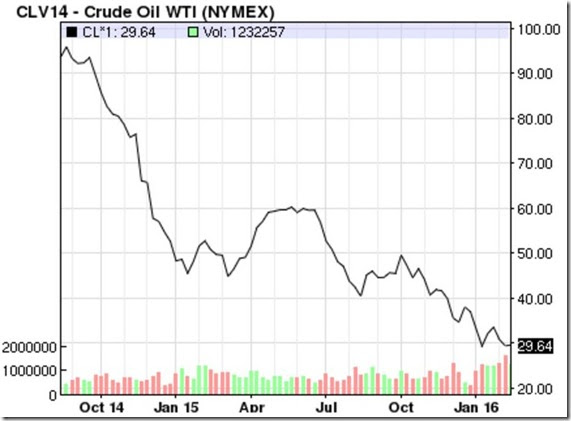
After oil prices flirted with $40 a barrel in January and March of 2015, oil prices rose back to the $60 a barrel range in May and June, which coincidentally was when our oil output suddenly spiked and set a record with production at 9,610,000 barrels per day during the week ending June 5th. That's pretty good evidence that the $60 a barrel oil this spring brought out some of that production that had been being held back since late 2014. We'll repeat that oil production chart we posted last week, and a chart with oil prices over the last 18 months, so you can more clearly see how that worked out.
The above chart, which we posted and explained last week, shows in blue the weekly volume of our oil output from September 2014 through the week ending February 5th, while below we have a current graph of contract oil futures prices over the same period. We can see that the first drop in a 5 year run-up of our oil production from 5 million barrels per day to 9 million barrels per day started in March, when oil prices were at their lowest. Then, shortly after oil prices moved back up into the $60 a barrel range, oil production spiked to a new record high ('unexpectedly' to everyone writing about it then). It appears that the $60 a barrel price was just enough to get producers to complete some of their DUC wells, a large number of which appear to have started production during the last two weeks of May, producing the spike we see on the crude chart above, and leading to the record production we saw in the week ending June 5th. Then as oil prices tanked again in July, fewer new wells were brought on, and hence production fell back to the 9.1 to 9.2 million barrels per day range we saw in September and October, as that initial surge we saw in the production graph tapered off...
What we can draw from this observation is that should oil prices rise towards $60 again, a large number of those 4,000 DUC wells will likely be completed (ie, fracked) and they'll start producing. As our production charts show, oil production in the first month after fracking has been averaging between 220 barrels per day per well and 440 barrels per day per well. Should oil prices suddenly spike, then, it's certainly possible we could see an incremental increase in production of between 500,000 and 1,000,000 barrels per day, on top of what we're already producing.. To put that amount into perspective, the threat by Iran that they'd be adding a half million barrels per day to the global oil glut is what caused oil prices to tank this winter, so it's possible US producers could easily add a similar amount themselves, should they start fracking their backloG. Of course, that would only exacerbate the glut, and hence drive prices down again. Thus, absent an agreement between Russia and OPEC to actually cut oil production (or a war in the middle east, which is always possible), $60 a barrel, or whatever price it takes to bring the DUC wells to completion, certainly looks like a ceiling for oil prices for some time to come..
Returning to our weekly data, this week's reports showed that refinery processing of crude oil rose for the first time since the week ending December 25th, as US refineries used 15,848,000 barrels per day during the week ending February 12th, 338,000 barrels per day more than the 15,510,000 barrels per day they processed during the week ending February 5th, as the US refinery utilization rate also rose for the first time this year, from 86.1% in the week of the 5th to 88.3% of their operable capacity last week. Our gasoline production rose again, from 9,553,000 barrels per day during week ending February 5th to 9,675,000 barrels of gasoline per day during week ending February 12th, 5.4% more than the 9,180,000 barrels per day gasoline production of a year earlier, and again the most gasoline we've produced in a week since December. Likewise, our output of distillate fuels (ie, diesel fuel and heat oil) rose by 306,000 barrels per day to 4,663,000 barrels per day during week ending the 12th, which was also 34,000 barrels per day higher than our distillate production of the same week a year ago...
With the increase in production, unused supplies of both major refinery products also rose. Our end of the week supply of gasoline in storage rose for the 14th week in a row, increasing from 255,657,000 barrels as of February 5th to a record 258,693,000 barrels as of February 12th. That was 6.4% more than the 243,132,000 barrels of gasoline that we had stored on February 13th last year, which was at that time a 15 year high for gasoline stores. Likewise, our distillate fuel inventories also rose, increasing by by 1,399,000 barrels to 162,375,000 barrels, due to a combination of reduced demand for both heating and for oil field work, which itself is a major consumer of diesel fuel. While not a record, our distillate inventories are now nearly 35 million barrels, or 27.4% higher than the same week last year, and above the upper limit of their average range for this time of year. And even with the pickup in refining, however, we still had another 2,147,000 new barrels of crude oil left unused at the end of the week, and hence that was added to our already nearly full storage tanks to set another new record for our stocks of crude oil in storage, which rose to 504,105,000 barrels at the end of the week. Our crude oil glut has been setting records like that on and off since January 30th of last year, when we first topped 400 million barrels of oil in storage for the first time in the EIA records.
NB: the above was first posted at Focus on Fracking, where there is much more..

Comments
excellent detail rjs
A cartel also rises.