
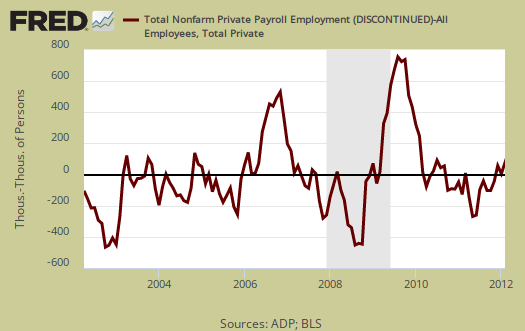
ADP, released their proprietary private payrolls jobs report. This month ADP is reporting a gain of 216,000 private sector jobs in February. January 2012 was revised up from 170,000 to 173,000. In contrast, the BLS reported 257,000 private sector jobs for January 2012. Graphed below are the reported private sector jobs from ADP. This report does not include government, or public jobs.

ADP's numbers claim the service sector created 170,000 jobs while the goods sector gained 46,000 jobs. Manufacturing increased by 21,000 jobs for the month. ADP's financial services jobs increased by 14,000 jobs, and is the largest gain in two years. This report, if it matches Friday's official unemployment report, would overall imply another real growth for jobs. We know there will be more government job declines and we need at least 90,000 jobs created each month just to keep up with population growth. Some analysts claim February is the month most closely correlated with the BLS official monthly private job numbers.
Construction gained 16,000 jobs for February 2012, the 5th monthly gain in a row.
ADP captures jobs by business size and this is worth looking at, especially due to it's relativity within the same report (and methods). In February:
Employment on large payrolls—those with 500 or more workers—increased 20,000, and
employment on medium payrolls—those with 50 to 499 workers—rose 88,000 in February.
Employment on small payrolls—those with up to 49 workers—rose 108,000 that same period. Of the 108,000 jobs created by small businesses, 18,000 jobs were created by the goods-producing sector and 90,000 jobs were created by the service-producing sector.
Below is the graph of ADP private sector job creation breakdown of large businesses (bright red), median business (blue) and small business (dark red). For large business jobs, the scale is on the right of the graph. Medium and Small businesses scale is on the left.

This is the same result, month after month. While this month is another improvement, generally, large business, who lobby Congress for their bad trade deals, more offshore outsourcing through foreign guest worker importation and labor arbitrage, are almost absent from job creation in terms of hiring Americans. Notice how large businesses have been declining and the pattern starts just about the time offshore outsourcing and the China PNTR came into effect in the above graph. Small businesses, on the other hand, have increased employment. May I suggest that small businesses are not international, they are not signing offshore outsourcing contracts and moving jobs to India and China. Multinationals, on the other hand, the below decade trend line clearly shows these so called U.S. corporations have abandoned the U.S. worker, on whole.
There is a historic strong mismatch between ADP and the BLS jobs report, although recently the two are converging again recently. To date, the number of private nonfarm payroll jobs ADP reports versus what the BLS reports and on a month-to-month and even cumulative basis do not match. This monthly error is often large, especially when looking at small job growth overall (< 400,000 jobs per month) on a month to month basis. The monthly reported BLS jobs is often within their survey 100,000 payrolls margin of error.
Below is the cumulative difference between what the ADP reports as the private nonfarm payroll jobs vs. the BLS (ADP minus BLS). This line shows the divergence, over time in number of nonfarm private payroll jobs reported between the two reports. The difference seems to be stabilizing around 400,000. This article is updated with the February BLS payrolls data.
While ADP notes a simple correlation of 0.95, well, a 5% error between monthly reported jobs numbers is an average, and we can see on some months the differences are quite large and around 2008, the difference started to hit about 900,000 jobs. That said, the reported job growth is so piss pour, statistically we're rolling around in the margin of error each month.
ADP does use the same seasonal adjustment as the BLS, but their other methodology and even sampling size are different, proprietary. That said, ADP has now put up some details of their methodology to explain the statistical differences between their estimate, the actual mathematics, vs. the BLS. This is new, and good ADP is disclosing their entire methodology so we may get more apples to apples comparisons of the two reports. The graph below is the monthly change of private jobs as reported by ADP.

Regardless of the statistical differences between ADP and the BLS, this indicates a continuing return to mediocre job growth. Sorry folks, 200k job growth numbers are not stellar, we're all simply used to seeing beyond belief, pathetic job growth numbers. We still have estimated 28 million people needing a job. Four Hundred thousand monthly job growth, on the other hand, would be something to sing hallelujah over.
Here is the January 2012 ADP private sector jobs report overview, only graphs revised.
how many jobs each month to keep up with population growth
We literally calculate that each month from the CPS data when we overview the BLS jobs report.
That said, the Federal Reserve has a neat little tool, a job growth calculator.
I checked the Fed's job growth calculator and it's accurate, using the same calculations we do here by hand each month on the data.
Now while one can argue other issues, such as base population, labor participation rates, figuring out how many jobs are needed each month to keep up with population, if one takes the other data metrics as accurate, are simply percentages.
Anyway, the tool is nice for it lets you see how many jobs you need over what time frame to get to 4% unemployment rates, yeah those, the ones before 2008.
Good stuff-great charts! I
Good stuff-great charts! I wonder if anyone knows how many new "job creators" helped this picture (just being sarcastic). Obama 2012!
"job creators" + February ADP pretty damn close to BLS
ADP was 216k private sector jobs. BLS was 233k private sector jobs so it does appear for February at least, the data metrics converse. (great, 1 month out of 12?)
On "job creators", I think you're referring to those uber-rich and executives that somehow need their capital gains and income tax free, since of course they will then just spend that money (ha ha ha, it's called wealth, they keep it!) and somehow boost the economy by buying more private aircraft and yachts. Or somehow executives must have those obscene multi-million dollar bonuses in order to hire someone.
That said, one thing I really like about the ADP report is the breakdown of job creation by small, median and large businesses. We can see large businesses are clearly busy hiring in China and India, not giving a rats ass about the U.S. worker. The above graph tells the same story, month after month.