Pundits and press love to gush over the employment report the minute they see proof of life Yet, things are still not rosy. The new official unemployed tally is 12,806,000. The average length of unemployment is still very high, 40.0 weeks, even while dropping a 10th of a percentage point from last month.

People unemployed for 27 weeks or more is now 42.6% of the total unemployed, or 5,426,000 million and a seasonally adjusted drop of 92,000 from last month. This percentage has barely budged as a percentage of total unemployed in comparison to pre-recession and historical levels.

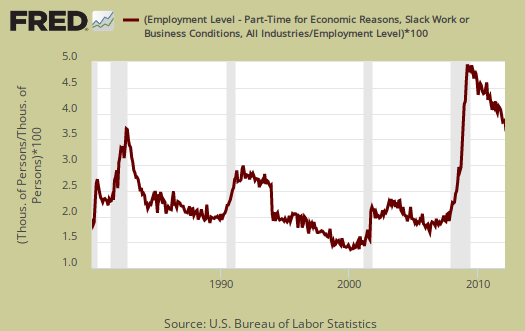
Some people are in part-time jobs because they want to be, others because they cannot find anything else. Some are stuck in part-time because they got their hours cut by their employer and these part-timers now number 5,446,000, an uptick of 74,000 in February.
Below is a graph of forced part-time because they got their hours cut as a percentage of the total employed. If you want to see a recession economic indicator, this looks like a pretty damn strong one. See how closely the percentage increase matches recessions, the gray bars? The percentage of people in part-time jobs due to slack economic conditions has stayed extremely high since the start of the Great Recession, even while declining. An uptick of any size is simply something we do not want to see.
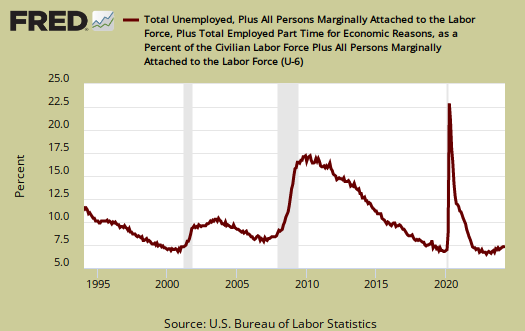
U-6 is a broader measure of unemployment, includes the official unemployed, people stuck in part-time jobs and a subgroup not counted in the labor force but are available for work and looked in the last 12 months. U-6 has also remained consistently high. In February U-6 was 14.9%, down two percentage points from January's 15.1% U-6 rate.
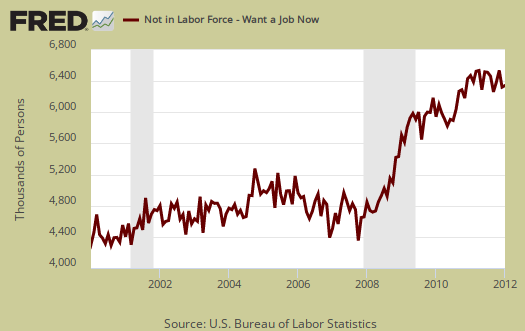
The real number of people wanting a job for February is 27.3 million. One needs to add up the official unemployed, people stuck in part-time who need full-time jobs, and all of those people not in the labor force, but who report they actually want a job, currently at 6.378 million.
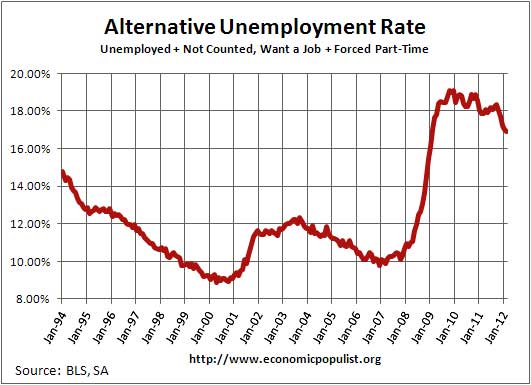
This gives an unemployment rate of 16.93%, calculated following the methods from this article on estimating the real unemployment numbers.
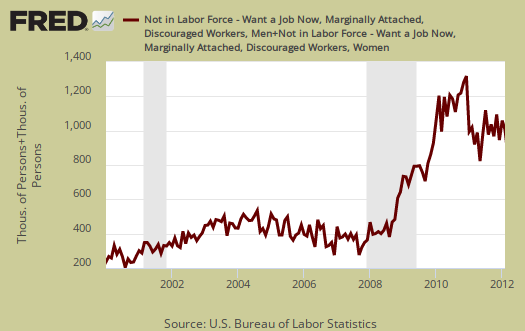
Another indicator things are not so rosy is the number of discouraged workers remains highly elevated. Discouraged workers are people, not counted as part of the civilian labor force, who not only want a job, but also looked for one in the last year. These people aren't job hunting now because they believe there are no jobs out there. Below is the graph of discouraged workers, currently at 1.01 million.
A final area of contention is figuring out how many jobs are needed each month to keep up with population growth. Seems many in the press just throw out a number. We just don't know due to civilian non-institutional population fluctuation. We do know that overall population monthly growth has been hovering around 200,000 a month and we also know the civilian non-institutional population is roughly 75% of the total population. We also know the labor participation rates and employment to population ratios are artificially low. Therefore, it's safe to say we need about 100,000 jobs per month to keep up with population growth. The Atlanta Fed got sick of the debate it seems and put up a monthly jobs calculator. Appears 100,000 is right on the money for the monthly jobs needed to keep up with population growth, 101,693 in fact. We've checked the Atlanta Fed's job calculator, it is correct, using the same methods we have done on this site, by hand.

the "real" unemployment rate, back by popular demand
Folks, you might notice we finally graphed up the calculation which includes those reporting they want a job, who are not in the labor force, from the survey. Many have appreciated this calculation, so we finally graphed it all up for you. We kept the series as early as possible to show, since 1994 at least, there has always been a segment of those not in the labor force who report want a job. There have always been, esp. after they changed some of the BLS methods in the 1990's, a segment of people who want a job but are never actually counted in the official statistics.
We've seen many comments looking for this rate so this time I thought you all might like a graph of it.
Happy unemployment day!
What do these jobs pay?
Sheer numbers of employed/unemployed is only part of the story. What sort of jobs are these? They seem concentrated in health care and other industries that do not pay well, besides so many of these jobs being part time. I know a lot of economists are sure that part time jobs will eventually convert into full time jobs as the economy picks up strength. Even if it does, are these still going to be full time jobs at $11/hr?
The point here is that if future job growth is going to be comprised of fewer $40,000/yr jobs and more $15,000/yr jobs, the US is merely on the path of lower living standards, whether or not it can continuously create more than 100,000 jobs a month. I'd also like to know whether pockets of the United States, particularly the inner cities, are looking more and more statistically like third world countries (in terms of rates of unemployment, average take-home income, presence of barter and black market economic conditions, crime, poverty, etc.).
By the way, your Discouraged Workers chart looks something like the housing inventory charts - the same sort of heavy black cloud overhangs the job market as it does the housing market.
crappy jobs
Most are crappy jobs and health care jobs. I'll have to do a charting of the types of jobs over the last year from payrolls to get a better sense of what types of job creation are going on.
i.e. you're right. Discouraged workers dropped this month but between the "not in the labor force" numbers and people in crappy part-time jobs who need full time, good analogy, the "shadow inventory" of people.
BLS birth-death model
Hi, Robert! I'm still following EP, although not as active as I used to be.
Paul Craig Roberts (March 10) relies on shadowstats critique of the BLS "birth-death model." I know you have criticized shadowstats' methodology in the past, but I don't believe issues of the birth-death model were considered. I am referring to your blog article from last August, linked above, namely --
What's the Real Unemployment Rate?
I gather that there is a suspicion that there is an underreported or underestimated increase in the recent mortality rate in the USA. That would not necessarily be the overall mortality rate but the mortality rate for the long-term unemployed population -- or, at any rate, for the workforce (excluding retired and disabled). It's an interesting problem in statistical analysis, and I am not prepared to cite any solid results in that regard. I doubt that the data have been collected, although certainly estimates may have been made. Of course, there are known rates for deaths on the job, but maybe not for deaths prior to retirement or while unemployed, especially since 'retired', 'disabled' and even 'unemployed' may not be well-defined.
Below is excerpted for review purposes from OpEdNews.com (Paul Craig Roberts column) --
'No Jobs For Americans' by Paul Craig Roberts
birth/death model
Honestly I haven't looked at it recently. First, this is businesses not counted by state tax receipts, which I have issue with that because #1 when hiring employees is SA insurance and the state will go over any business not registering and paying into the UI fund.
Then, it was very clear the model was off significantly in 2009, where the "deaths" of businesses were dropping like flies.
I'm not of the school where it's all a big fat lie, repeatedly point out the Birth/death model is first applied to NSA, then everything is SA....
but I can revisit again. I know Roberts likes shadowstats and the reason I rarely mention him is I cannot get a clear answer on his methodology. I pull out raw statistics continually from the BLS and I don't know exactly what else shadowstats is doing, assuming he is using base numbers, so I cannot validate his methods.
Ooops, I was close to confusing corporations with people!
I knew that the model was for businesses, but somehow a cog slipped in my brain and I went off on a tangent.
If we're at the level of truly small businesses -- like Mom-and-Pops and the classic independent operators/partnerships -- then we're close to or at the level of the underground economy.
I am informed that on a typical agricultural crew (like vineyard workers in the Southwest or treeplanters in the Pacific Northwest), for every worker officially carried on worker comp and UI insurance, there are maybe three who are not counted. Similar situations sometimes are seen with gypo roofing, small fishing boats, etc.. This is especially the situation when illegal immigrants with falsified papers are involved.
Even without considering the birth/death model for businesses, we're mostly in a world of "creative" accounting when we get to working families who are scrambling to survive. Some of these working people will be counted in food stamp numbers, but many (including natural-born citizens) will avoid any kind of government office or program. In any case, these people are not likely to report numbers reflective of reality.
I was confusing the birth/death model with possible questions about differential mortality rates for real people -- members of workforce, long-term unemployed, etc., versus the overall averages that are generally broken down only by gender, age and ethnicity (and not much else).
It's hard to count jobs, hard to count the number of jobs created in a period of time, hard to count the people living in a given area during a period of time, hard to count transients, hard to count the number of people who are working, hard to count the number of unemployed who would be working if jobs were available, and, very hard to count the number of underemployed.
I still like the idea of including numbers developed from advertising real jobs for real money to see how many people (citizens and legal residents) show up and take the jobs, gathering data on individuals along the way. Such an approach takes the goal of full employment seriously.
yes, birth/death are businesses, not people
This is why I go over the BLS is such gory detail each month, even when one has a statistical background, it can get really confusing. We haven't even touched on implicit price deflators from the BEA, now there I really get "garbage" when trying to hand calculate back to what they get.
Jobs are reported by businesses, there is a survey they ask and the birth/death is to capture those businesses on a monthly basis which are started up and also went under.