
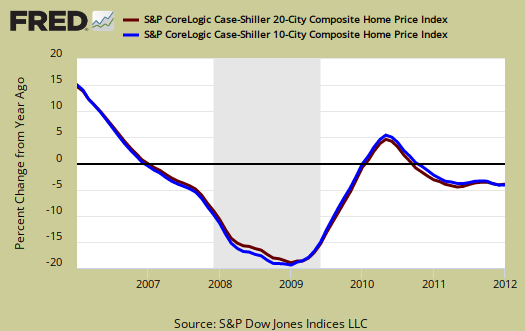
The S&P Case Shiller home price index shows a -3.8% decline from a year ago over 20 metropolitan housing markets and a -3.9% decline for the top 10 housing markets from January 2011. Home prices are back to January 2003 levels and both composite indices hit, yet again, new lows. Both composites are now down -34.4% from their 2006 home price bubble peaks. Below is the yearly percent change in the composite-10 and composite-20 Case-Shiller Indices. These are not seasonally adjusted, but comparing from January 2011.
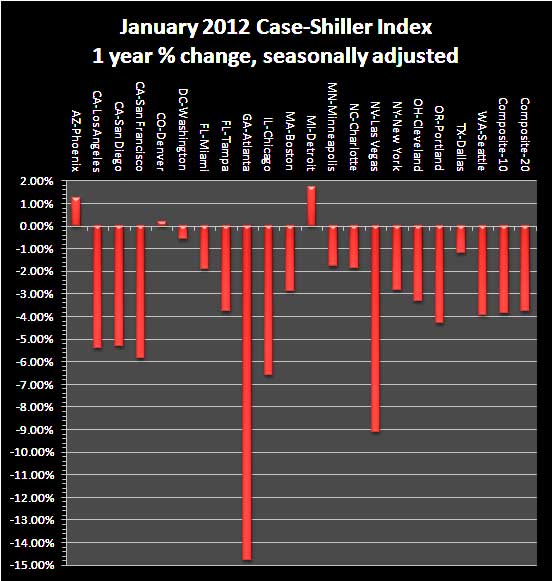
Atlanta is simply on fire and not in a good way. From S&P, using not seasonally adjusted data:
Atlanta continues to stand out in terms of recent relative weakness. It was down 2.1% over the month, and has fallen by a cumulative 19.7% over the last six months. It also posted the worst annual return, down 14.8%.
Atlanta's housing bubble peaked about a year later than other cities, yet still Atlanta seems well on their way to become the next Las Vegas for residential real estate. Altanta foreclosures are currently 1 for every 244 housing units and Georgia is currently ranked 4th in foreclosures nationally.
News headlines on the S&P Case-Shiller Housing Index often differ. Some in the press use the seasonally adjusted data, and others do not. S&P themselves use the not seasonally adjusted housing price data. To make matters worse, some in the press compare just the monthly not seasonally adjusted data and others compare the housing price index to one year ago, without telling you what number they are quoting from S&P. That's why on this site we make sure you know which apple you're looking at, all data is identified. For more details on seasonal adjustments, see the bottom paragraphs of this overview.
This month the not seasonally adjusted December to January change for the composite-20 was -0.8%. The seasonally adjusted composite-20 monthly change was 0.0%, or no change. The composite-10 not seasonally adjusted monthly change was -0.8% and the seasonally adjusted composite-10 monthly change was -0.1%. Intuitively, the divergence of the seasonal adjustments in January makes sense. The housing season is over. Bottom line, anyway you look at the Case-Shiller numbers, single family housing prices declined.

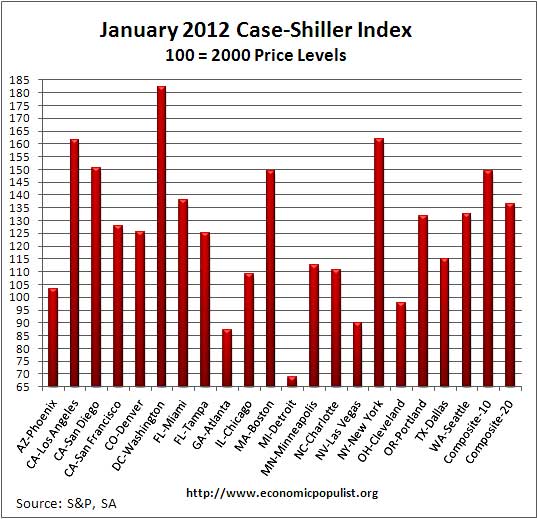
The above graph shows the composite-10 and composite-20 city home prices indexes, seasonally adjusted. Prices are normalized to the year 2000. The index value of 150 means single family housing prices have appreciated, or increased 50% since 2000 in that particular region. These indices are not adjusted for inflation. The composite-20 index, seasonally adjusted is 136.6 and comparable to January 2003 levels (ignoring 2009). Not seasonally adjusted the composite-20 index is 135.46, between December 2002 and January 2003 levels. Clearly the bottom in home prices has not been reached.
Below are the seasonally adjusted indices for this month. Charlotte, North Caroline did not report their data in time. The below graphs use Charlotte's December values.
Below are all of the composite-20 index cities yearly price percentage change, using the seasonally adjusted data.
When it comes to annual data, the seasonally adjusted and not seasonally adjusted should start to converge. Here is S&P's comment on their figures, using the not seasonally adjusted data from their January report. Bottom line, there are those in the press so wishing the housing bottom was reached, they will attempt to spin any number, any report. The data from every direction tells us residential housing is not quite done in it's great slide back from casino to home-sweet-home reality.
In January 2012, Denver, Detroit and Phoenix were the only MSAs to post positive annual returns. Month-over-month, Miami, Phoenix and Washington DC were the only cities that recorded positive gains -- up 0.6%, 0.9% and 0.7% in January 2012, respectively. Both the 10 -City and 20 -City Composites were down 0.8% from their December 2011 levels. Eights MSAs (Atlanta, Chicago, Cleveland, Las Vegas, New York, Portland, Seattle and Tampa) and both Composites posted new index lows in January 2012. Atlanta, Cleveland, Detroit and Las Vegas continue to have average home prices below their January 2000 levels.
To Season or Not to Season, That is the Question:
The S&P/Case-Shiller Home Price Indices are calculated monthly using a three-month moving average and published with a two month lag. Their seasonal adjustment calculation is the standard used for all seasonal adjustments, the X-12 ARIMA, maintained by the Census.
So, why would S&P report the not seasonally adjusted data? According to their paper on seasonal adjustments, they claim the not seasonally adjusted indices are more accurate. It appears the housing bubble burst screwed up the cyclical seasonal pattern. What a surprise, although those steep cliff dives are now going back to 2009, one would think the seasonally adjusted data would now start to converge back to it's cyclical, seasonal pattern.
The turmoil in the housing market in the last few years has generated unusual movements that are easily mistaken for shifts in the normal seasonal patterns, resulting in larger seasonal adjustments and misleading results.
Not seasonally adjusted data can create more headline buzz on a month by month basis due to the seasonality of the housing market. S&P does make it clear that data should be compared to a year ago, to remove seasonal patterns, yet claims monthly percentage changes should use not seasonally adjusted indices and data. This seems more invalid than dealing with the statistical anomalies the massive housing bubble burst caused.
For more Information:
For more analysis, we recommend Calculated Risk, who does correct, extreme analysis and graphing on Case-Shiller data.
S&P does a great job of making the Case-Shiller data and details available for further information and analysis on their website.
Here is our overview from last month.
Recent comments