
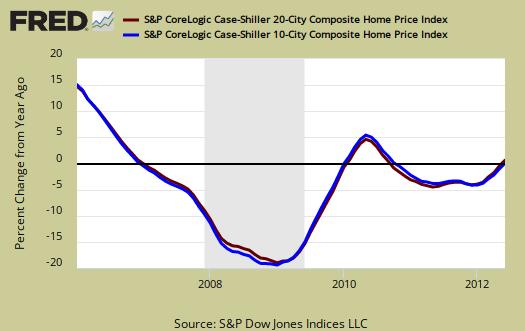
The June 2012 S&P Case Shiller home price index shows a 0.5% price increase from a year ago for over 20 metropolitan housing markets and a 0.1% change for the top 10 housing markets from June 2011. Not seasonally adjusted home prices are now comparable to July 2003 levels for the composite-20 and September 2003 for the composite-10. Below is the yearly percent change in the composite-10 and composite-20 Case-Shiller Indices, not seasonally adjusted.
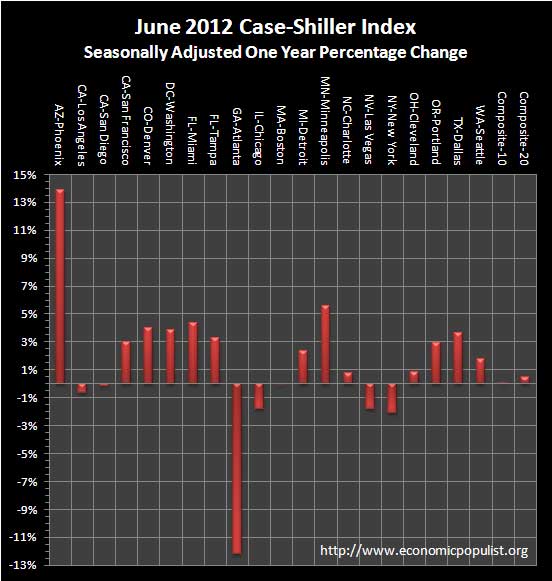
Below are all of the composite-20 index cities yearly price percentage change, using the seasonally adjusted data. We see Phoenix continue to rise, up 13.9% from a year ago and Atlanta is still burning, but the decline is less than last month, down -12.2% from a year ago. Using the seasonally adjusted data, the composite-20 yearly percentage change was 0.46% and the composite-10 yearly percentage change was 0.06%.
S&P reports the not seasonally adjusted data for their headlines. Housing is highly cyclical. Spring and early Summer are when most sales occur. See the bottom of this article for their reasoning.
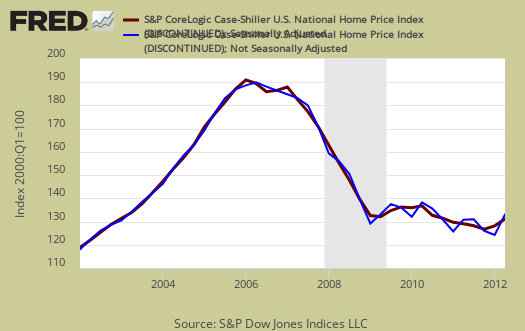
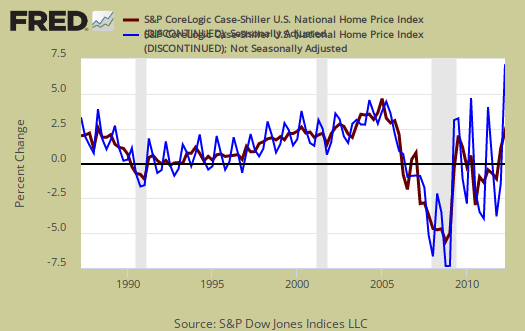
S&P also produces a third national index. S&P is using the not seasonally adjusted national index when they report Q2 home values are up 1.2% from Q2 2011. Below is the national index, not seasonally adjusted (blue), which are used as the headline numbers, against the seasonally adjusted one (maroon).
Below is the Q2 2012 percent change against Q2 2011. The seasonally adjusted change was 1.1% from the second quarter a year ago.

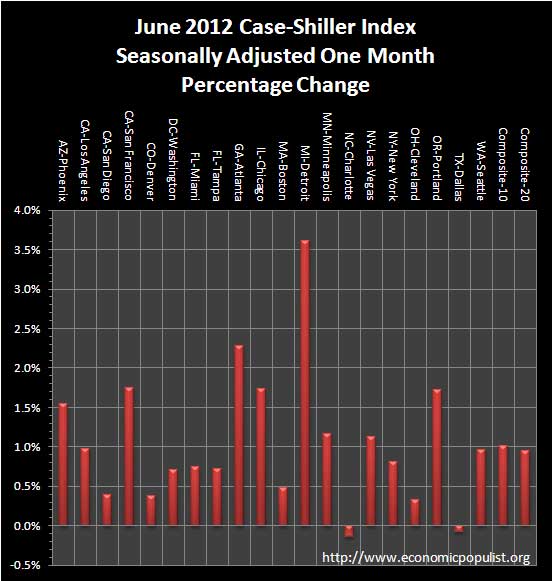
For the month, the not seasonally adjusted composite-20 percentage change was 2.3% whereas the seasonally adjusted change for the composite-20 was 0.94%. The monthly not seasonally adjusted composite-10 percentage change was 2.2%, whereas the seasonally adjusted composite-10 showed a 1.01% increase. Both are positive, but this is the height of the buying season, so we take more stock in the seasonally adjusted figures.
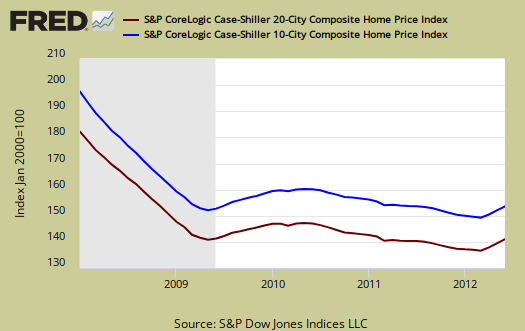
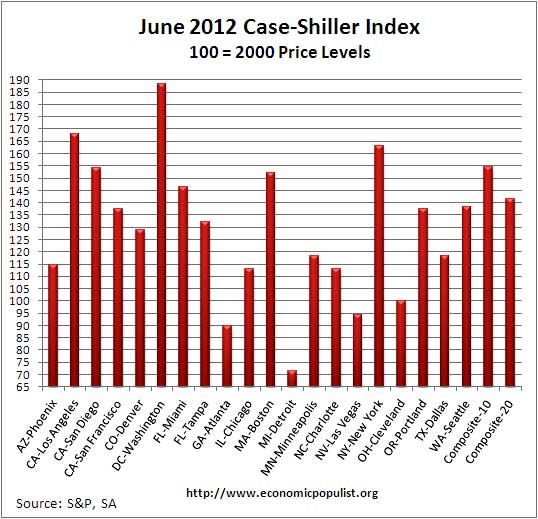
The above graph shows the composite-10 and composite-20 city home prices indexes, seasonally adjusted. Prices are normalized to the year 2000. The index value of 150 means single family housing prices have appreciated, or increased 50% since 2000 in that particular region. These indices are not adjusted for inflation.
News headlines on the S&P Case-Shiller Housing Index often differ. Some in the press use the seasonally adjusted data, and others do not. Some report the monthly change, others the annual change. S&P themselves use the not seasonally adjusted housing price data. To make matters worse, some in the press do not specify which statistic they are quoting from S&P. Below are the seasonally adjusted monthly home price percentage changes for each City reported by S&P.
Below are the seasonally adjusted indices for this month. Folks spin these indexes with percentages while the index itself tells you what has happened to home prices, per city, from the year 2000.
Either way you look at this month's data, most metropolitan area housing prices seem to be stabilizing. From the S&P press release, using the not seasonally adjusted home price indices, S&P is saying the housing market has turned around, quoted below. We don't expect a meteoric rise, come on here, the annual results are really flat Still, the biggest issue , almost never acknowledged, is how home prices are not affordable by today's repressed wages and incomes, as well as the ongoing jobs crisis. One simply cannot afford even a $200,000 mortgage when a household earns $42,000 a year.
Only two cities – Charlotte and Dallas – saw annual rates of change worsen in June. The other 18 cities and both composites saw improvement in this statistic, and 13 of these had a positive trend. There were only six cities – Atlanta, Chicago, Las Vegas, Los Angeles, New York and San Diego – where the annual rates of change were still negative. Boston’s annual rate was flat. We seem to be witnessing exactly what we needed for a sustained recovery; monthly increases coupled with improving annual rates of change. The market may have finally turned around.
To Season or Not to Season, That is the Question:
The S&P/Case-Shiller Home Price Indices are calculated monthly using a three-month moving average and published with a two month lag. Their seasonal adjustment calculation is the standard used for all seasonal adjustments, the X-12 ARIMA, maintained by the Census.
So, why would S&P report the not seasonally adjusted data? According to their paper on seasonal adjustments, they claim the not seasonally adjusted indices are more accurate. It appears the housing bubble burst screwed up the cyclical seasonal pattern. What a surprise, although those steep cliff dives are now going back to 2009, one would think the seasonally adjusted data would now start to converge back to it's cyclical, seasonal pattern.
The turmoil in the housing market in the last few years has generated unusual movements that are easily mistaken for shifts in the normal seasonal patterns, resulting in larger seasonal adjustments and misleading results.
To see S&P's argument in action, look at the below graph. The maroon line is the seasonally adjusted national index, reported quarterly. The blue line is the not seasonally adjusted national index. As we can see before the housing bubble burst, we see a typical cyclical pattern difference between the seasonally adjusted and not seasonally adjusted data points. Yet after the bubble burst we see large swings, which would throw off a seasonal adjustment adaptive algorithm. This is going to become a major question among statisticians, how does one adjust for seasonality in the face of tsunami like economic events?
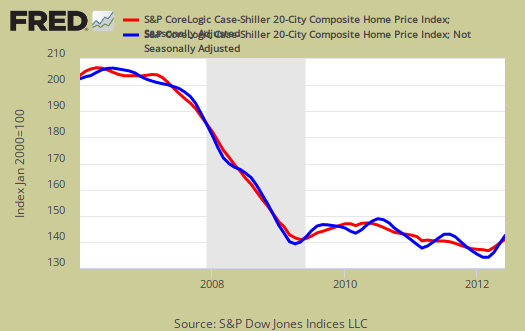
Not seasonally adjusted data can create more headline buzz on a month by month basis due to the seasonality of the housing market. S&P does make it clear that data should be compared to a year ago, to remove seasonal patterns, yet claims monthly percentage changes should use not seasonally adjusted indices and data. This seems more invalid than dealing with the statistical anomalies the massive housing bubble burst caused. Below is the seasonally adjusted and not seasonally adjusted Composite-20 Case-Shiller monthly index.
For more Information:
S&P does a great job of making the Case-Shiller data and details available for further information and analysis on their website.
Here is our overview from last month.
affordability
"a $200,000 mortgage when a household earns $42,000 a year" at 3.55% is $903.58 a month
the so-called housing recovery is merely a fiction of Fed manipulated interest rates, which will not stay this low forever...
$42k/yr
is $3.5k a month gross, after taxes, single, although varies greatly on State to State, assume take home pay is $2800 with income tax, FICA, Medicare (yes folks, you pay for Medicare while working). Your mortgage doesn't include taxes and insurance so tack on another $200, that leaves roughly $1700 for food, retirement, health care, transportation and if not offered through work, health insurance premiums significant. Mortgage payments are supposed to be no more than 25% of your gross, so that's already exceeded it. But the median wage in this country is $26.4k. This is for a single person, who I think could squeeze by here but a family on $42k a year, no way.
skipping Case-shiller home indices
We're skipping the overview on S&P Case-Shiller home prices. You can go to their website, here.
The thing to point out is the report is not seasonally adjusted. Seasonally adjusted the composite-1 increased 0.4% and the composite-20 increased 0.5%. Not seasonally adjusted both indices increased 0.9%. Seattle was the only city to be negative, seasonally adjusted it was -0.1%. Generally the increase was less in August than July.
We suspect the hurricane will affect home prices in October, so bottom line, there wasn't anything significant to report here and because of the East coast crisis, we've been putting other issues at higher priority.
Also, the housing bust is over so we think S&P should switch back to the seasonally adjusted indices as their headline buzz numbers.