
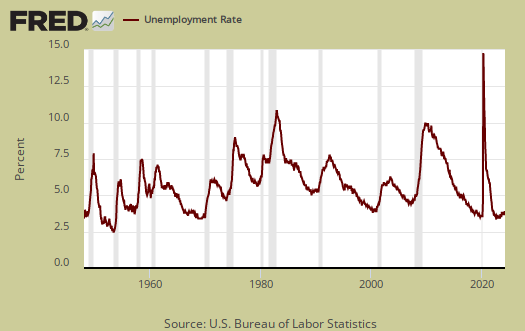
February's unemployment report is just another no change type of thing. The unemployment rate is 4.7%, a -0.1 percentage point change from last month. Those unemployed declined slightly as did those no longer in the labor force. The labor participation rate finally hit 63.0% which is still very low The biggest movement was those employed increased by 447 thousand. Folks, there just isn't much to write home about again. On paper things continue to look great, yet we all know there are millions underemployed and not working who should be., although things have clearly improved.
This article overviews and graphs the statistics from the Employment report Household Survey also known as CPS, or current population survey. The CPS survey tells us about people employed, not employed, looking for work and not counted at all. The household survey has large swings on a monthly basis as well as a large margin of sampling error. This part of the employment report is not about actual jobs gained, as reported by businesses, but people and their labor status.
Those employed number 152,528,000, a 447,000 increase from the previous month. From a year ago, the ranks of the employed has increased by 1.485 million. The annual gain is just around what is required to keep up with new population growth.

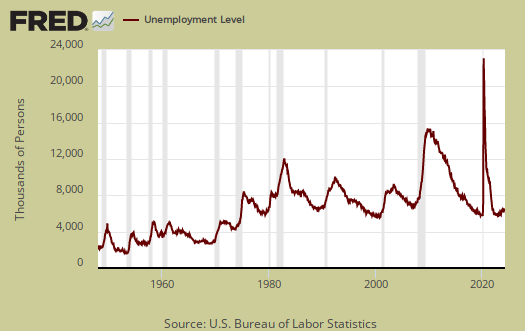
Those officially unemployed is 7,528,000, a -107,000 monthly drop although this number has been fairly static for some time now. From a year ago the unemployed has decreased by −317,000, which is statistically static and with such a low official unemployment rate, not surprising.
Those not in the labor force is 94,190 million. The below graph are the not in the labor force ranks. Those not in the labor force declined by -176,000 for the month and from a year ago, a 500 thousand person increase.

The labor participation rate is 63.0%, which is still terrible, but a 0.1 percentage point uptick from last month. No one seems to mention the extremely low labor participation rate with such a great unemployment rate anymore. It is another statistic buried in the everything is fine, sweep it under the rug dust. Pre-recession, the January 2008 labor participate rate was 66.2% and one must remember the job market was not good pretty much after 9/11.

Below is a graph of the labor participation rate for those between the ages of 25 to 54. The rate is now 81.7% which is 0.2 percentage point increase from last month. Ages 25-54 are the prime working years where people are not in retirement or in school full time as commonly as other age groups, so seeing this rate recover implies those hidden are now getting jobs. Yet, there is another ghoulish possibility in that those fired in the financial crisis are aging and might simply be no longer in this age bracket. In January 2008 the prime working years labor participate rate was 83.3%.

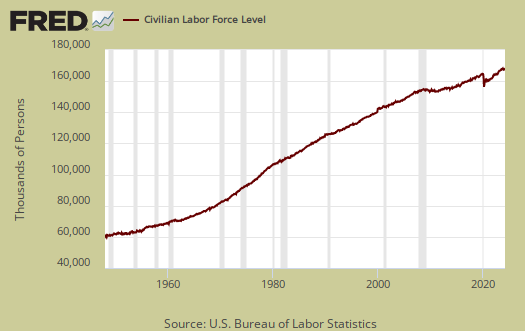
The civilian labor force, which consists of the employed and the officially unemployed is 160,056,000. The civilian labor force has grown by 1,168,000 over the past year. The BLS counts those on guest worker Visas and even illegal workers mixed in with permanent resident and citizen workers in their statistics.
Below is a graph of those not in the labor force, (maroon, scale on the left), against the noninstitutional civilian population (blue, scale on the right). Notice how those not in the labor force crosses the noninstitutional civilian population in growth. The civilian noninstituitonal population is from where all other labor statistics have sprung.

Below is a graph of the civilian labor force, or the official employed plus unemployed, in maroon, scale on left, against those not in the labor force, in blue, scale on right. See how those not in the labor force as a trend exceeded those considered employed and unemployed starting around mid 2009. Starting in 2014 it has reverted back, yet it oscillates starting in 2015. To have a solid employment situation those not in the labor force should be growing less than those obtaining jobs and being counted as looking for work. Those not in the labor force does include retirees and students and there is a baby boomer bump in both of these population groups.

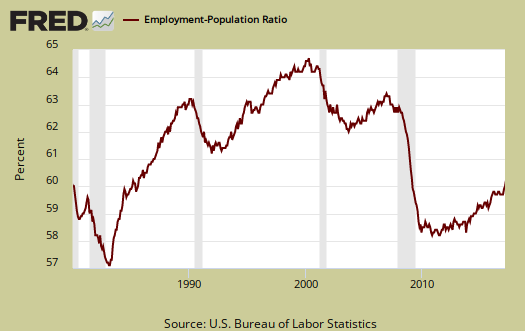
Those considered employed as a ratio to the total Civilian noninstitutional population is 60.0%, a 0.1 percentage point increase from last month In January 2008, this figure was 62.9%. The relationship between the employment-population ratio and the labor participation rate (LPR) is: employment-population ratio = LPR * (1 - unemployment rate).
February was yet another month where little changed. We never overview statistics by race or gender, yet for the record, Blacks have a 8.1% unemployment rate while Whites have a 4.1% rate and Asians, which is Chinese and Indians, etc. mixed all together, have a 3.4% unemployment rate. Here are our past overviews CPS unemployment statistics, only graphs revised.
Recent comments