
The U.S. May 2012 monthly trade deficit declined $1.91 billion to $48.68 billion. This is a 3.78% monthly decrease in the trade deficit, all due to reduced imports. Exports decreased $359 million, or -0.20%. Imports declined $1.55 billion, which is a -0.67% decrease from April. The decline in oil prices is the reason the trade deficit shrank for the month.

From May 2011 the trade deficit has increased $1.02 billion with exports increasing by $7.42 billion, or 4.2%, and imports were up $8.43 billion, or 3.76%. The three month moving average gives a trade deficit of $50.6 billion, up from $49.5 billion in April.
In terms of Q2 GDP estimates, if we take May's goods trade deficit and extend it to June, in real values, we have a $1.592 billion increase in the goods trade deficit from Q1. From Q1 to Q4 we had a -$324 million decline in the goods trade deficit. In other words, the return to never ending increasing imports will lower GDP for Q2.
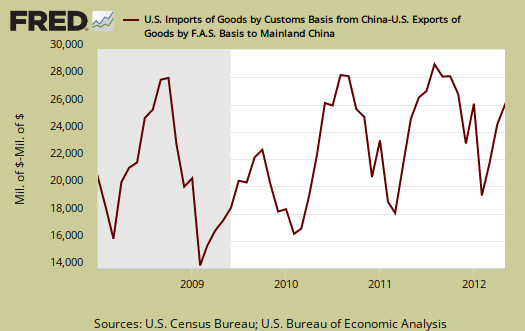
The U.S.-China goods trade deficit alone was, -$26.043 billion, or 38.8% of the total goods trade deficit. The not seasonally adjusted China-U.S. goods trade deficit increased $1.49 billion, or 6.1% from last month. The 38.8% ratio includes oil, our biggest commodity import. For comparison's sake the not seasonally adjusted goods trade deficit by Census accounting methods was -$67.108 billion. China's never ending import barrage is highly cyclical as one can see in the below graph of the deficit with China.
We should also mention the quick to increase South Korea-U.S. trade deficit. From January to May 2012 we have a -$6.12 billion trade deficit with Korea, a $1.3 billion increase from a year ago. March 15th the South Korean NAFTA style trade deal went into effect. Below is a graph of the Korean goods trade deficit, not seasonally adjusted and also cyclical, in particularly the cyclical high point seems to be December. Notice the balloon in the last two months and compare that to those same two months one year ago.

For comparison's sake, NAFTA went into effect January 1, 1994. Below is our goods trade deficit with Mexico, not seasonally adjusted.

Oil or petroleum showed an end use trade deficit of -$24.93 billion, for May, a decrease of -$3.15 billion, or -11.2%, from last month, a welcome relief as prices dropped. Petroleum related end use was 39.7% of the goods trade deficit. Petroleum related imports from China as essentially non-existent.
End use means the final use of the product. For example, plastics are made up of petroleum, yet by their end use category, would be marked often as consumer goods.
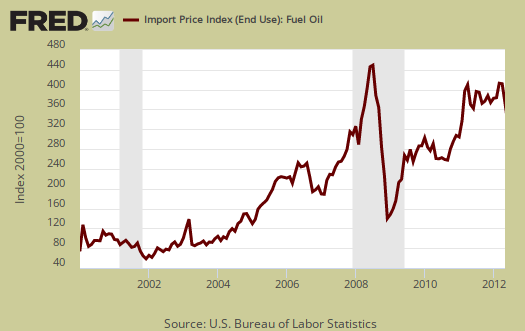
The United States basically has two major ongoing problems with the trade deficit, Chinese goods and Oil imports. Below is the not seasonally adjusted import price index for oil fuel. The average price for a barrel of oil in May was still high, $107.91. By volume, the U.S. imported 331,296 barrels of petroleum related products in May, an increase of 1.51% from April.
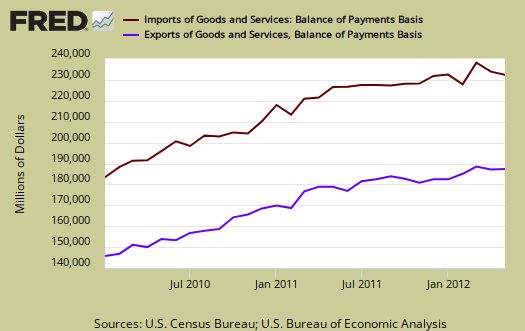
Below are imports vs. exports of goods and services. Notice how much larger imports are than exports, but also notice the growth, or rate of change between months of U.S. exports over time. To state the obvious, imports subtract from GDP and exports add.
Below is the list of good export changes from April to May, seasonally adjusted, by end use. Exports of goods increased $402 million on a Census accounting basis, whereas the headline buzz is the BOP accounting method, or $20 million for goods exports. Exhibit 7 gives Census accounting method breakdown for exports. Soybeans had a good month, with $861 million in exports. Industrial materials and supplies showed a -$878 million monthly decline in nonmonetary gold.
- Automotive vehicles, parts, and engines: -$0.105 billion
- Industrial supplies and materials: -$0.843 billion
- Other goods: -$0.047 billion
- Foods, feeds, and beverages: +$0.900 billion
- Capital goods: +$0.673 billion
- Consumer goods: -$0.177 billion
Below are the goods import monthly changes, seasonally adjusted. Overall imports decreased -$1.528 from last month on a Census accounting basis. The story here is oil, whose monthly change was -$2.818 billion to $27.42 billion in crude oil imports. This is a -9.32% monthly decline. Price matters.
- Industrial supplies and materials: -$3.568 billion
- Capital goods: +$1.418 billion
- Foods, feeds, and beverages: -$0.050 billion
- Automotive vehicles, parts, and engines: +$0.745 billion
- Consumer goods: -$0.375 billion
- Other goods: +$0.303 billion
Running a trade deficit in advanced technology is not a good sign for those jobs of tomorrow. The below report statistics are not seasonally adjusted.
Advanced technology products exports were $24.8 billion in May and imports were $33.4 billion, resulting in a deficit of $8.7 billion. May exports were $1.1 billion more than the $23.7 billion in April, while May imports were $3.1 billion more than the $30.3 billion in April.
Here is the breakdown with major trading partners, not seasonally adjusted. China is the worst trade deficit, as detailed above.
OPEC can be assumed to be oil and the OPEC nations are: Algeria, Angola, Ecuador, Iran, Iraq, Kuwait, Libya, Nigeria, Qatar, Saudi Arabia, United Arab Emirates, Venezuela.
The April figures show surpluses, in billions of dollars, with Hong Kong $2.9 ($3.3 for April), Australia $1.7 ($1.6), Singapore $1.0 ($0.7), and Egypt $0.1 ($0.2).
Deficits were recorded, in billions of dollars, with China $26.0 ($24.6), OPEC $11.2 ($11.5), European Union $10.5 ($8.7), Japan $6.4 ($6.3), Mexico $6.3 ($5.4), Germany $4.9 ($4.6), Ireland $2.7 ($1.9), Canada $2.2 ($3.3), Korea $2.0 ($1.8), Venezuela $1.6 ($2.1), Nigeria $1.4 ($1.7), and Taiwan $1.3 ($1.3).
Here is the BEA website for additional U.S. trade data, such as it is. May we suggest the Census make publicly available much more data so one can compare Apples to Apples, end use, NAICS and seasonally adjusted series.
You might ask what are these Census Basis versus Balance of Payment mentioned all over the place? The above mentions various accounting methods so we're comparing Apples to Apples and not mixing the fruit. The trade report in particular is difficult due to the mixing of these two accounting methods and additionally some data is seasonally adjusted and others are not. One cannot compare values from different accounting methods and have that comparison be valid.
In a nutshell, the Balance of Payments accounting method is where they make a bunch of adjustments to not count imports and exports twice, the military moving stuff around or miss some additions such as freight charges. The Census basis is more plain raw data the U.S. customs people hand over which is just the stuff crosses the border. The 2005 chain weighted stuff means it was overall modified for a price increase/decrease adjustment in order to remove inflation and deflation time variance stuff.
Bottom line, you want just the raw data of what's coming into the country and going out, it's the Census basis and additionally the details are only reported in that accounting format. Additionally the per country data is not seasonally adjusted so watch out trying to add those numbers into the overall trade deficit. It's a statistical no-no to mix seasonal and non-seasonally adjusted numbers.
Here is last month's trade deficit overview, data unrevised.
trade deficit overview, Korea, NAFTA graphs
Folks, you might really check out this month's trade data overview. A couple of graphs for you this time, to show these trade "deals" perpetually touted as helping the U.S. economy, clearly are not. Look at those deficits.