
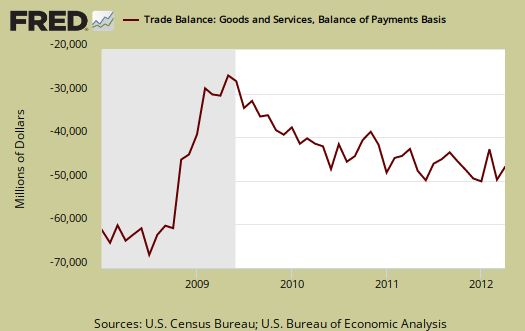
The U.S. April 2012 monthly trade deficit declined $2.56 billion to $50.06 billion. This is a 4.88% monthly decrease in the trade deficit. Exports decreased $1.53 billion, or -0.83%. Imports declined $4.09 billion, which is a -1.73% decrease from March. That said, don't be so overjoyed that the trade deficit declined. Not only did exports drop, the March trade deficit was revised upwards by 1.5%, from $51.83 billion to $52.62 billion.
From a year ago, the trade deficit just keeps growing and growing. From April 2011 the trade deficit has increased $6.5 billion with exports increasing by $7.2 billion, or 4.1%, and imports were up $13.8 billion, or 6.3%. In other words, imports growing faster than exports, as usual.
The U.S.-China goods trade deficit alone was, -$24.554 billion, or 39.7% of the total goods trade deficit and increased $2.88 billion from last month. This ratio includes oil, our biggest commodity import, is not seasonally adjusted and is on a raw customs accounting basis. For comparison's sake the not seasonally adjusted goods trade deficit by Census accounting methods was -$61.865 billion. China's never ending import barrage is highly cyclical as one can see in the below graph of the deficit with China.

Oil or petroleum showed an end use trade deficit of -$27.99 billion, for April, a decrease of -2.2%, from last month. Petroleum related end use was 43.4% of the goods trade deficit. Petroleum related imports from China as essentially non-existent.
End use means the final use of the product. For example, plastics are made up of petroleum, yet by their end use category, would be marked often as consumer goods.
The United States basically has two major ongoing problems with the trade deficit, Chinese goods and Oil imports. Below is the not seasonally adjusted import price index for oil fuel. The average price for a barrel of oil in April was a whopping $109.94. By volume, the U.S. imported 325,366 barrels of crude oil in April, a decrease of -2% from March.

Below are imports vs. exports of goods and services. Notice how much larger imports are than exports, but also notice the growth, or rate of change between months of U.S. exports over time. To state the obvious, imports subtract from GDP and exports add.

Below is the list of good export changes from March to April, seasonally adjusted, by end use. Exports of goods decreased $1.78 on a Census accounting basis, whereas the headline buzz is the BOP accounting method, or $1.46 billion. Exhibit 7 gives Census accounting method breakdown for exports. Aircraft took a big hit this month, a -$448 million decline in civilian aircraft and a -$310 million monthly drop in civilian aircraft engines. Soybeans, the largest food export, increased by $352 million for the month. Services exports decreased by -$0.1 billion for April.
- Automotive vehicles, parts, and engines: +$0.424 billion
- Industrial supplies and materials: -$1.007 billion
- Other goods: -$0.648 billion
- Foods, feeds, and beverages: +$0.700 billion
- Capital goods: -$1.455 billion
- Consumer goods: +$0.210 billion
Below are the goods import monthly changes, seasonally adjusted. Overall imports decreased -$3.924 from last month. Computers were the biggest one item decrease of -$979 million. Don't let that number fool ya, last month we imported an increase of over $1 billion in computers alone. That's increase from February. In industrial supplies, fuel oil lead the charge with -$497 million less in imports. Other petroleum related imports also decreased by -$392 million. Did America stop takin' drugs? This month saw a -$1.377 billion dollar decrease, that's monthly, in pharmaceutical preparation imports. Services imports increased $0.1 billion.
- Industrial supplies and materials: -$0.630 billion
- Capital goods: -$1.996 billion
- Foods, feeds, and beverages: -$0.008 billion
- Automotive vehicles, parts, and engines: -$0.363 billion
- Consumer goods: -$0.462 billion
- Other goods: -$0.466 billion
Running a trade deficit in advanced technology is not a good sign for those jobs of tomorrow. The below report statistics are not seasonally adjusted, so take this month's -4.2% advanced technology trade deficit decline with a grain of salt.
Advanced technology products exports were $23.7 billion in April and imports were $30.3 billion, resulting in a deficit of $6.7 billion. April exports were $4.2 billion less than the $27.9 billion in March, while April imports were $4.8 billion less than the $35.1 billion in March.
Here is the breakdown with major trading partners, not seasonally adjusted. China is the worst trade deficit, as detailed above.
OPEC can be assumed to be oil and the OPEC nations are: Algeria, Angola, Ecuador, Iran, Iraq, Kuwait, Libya, Nigeria, Qatar, Saudi Arabia, United Arab Emirates, Venezuela.
The April figures show surpluses, in billions of dollars, with Hong Kong $3.3 ($3.0 for March), Australia $1.6 ($2.0), Singapore $0.7 ($0.9), and Egypt $0.2 ($0.2).
Deficits were recorded, in billions of dollars, with China $24.6 ($21.7), OPEC $11.5 ($9.1), European Union $8.7 ($9.8), Japan $6.3 ($7.1), Mexico $5.4 ($6.1), Germany $4.6 ($5.5), Canada $3.3 ($3.0), Venezuela $2.1 ($2.7), Ireland $1.9 ($2.1), Korea $1.8 ($0.6), Nigeria $1.7 ($1.0), and Taiwan $1.3 ($0.7).
Here is the BEA website for additional U.S. trade data, such as it is. May we suggest the Census make publicly available much more data so one can compare Apples to Apples, end use, NAICS and seasonally adjusted series.
You might ask what are these Census Basis versus Balance of Payment mentioned all over the place? The above mentions various accounting methods so we're comparing Apples to Apples and not mixing the fruit. The trade report in particular is difficult due to the mixing of these two accounting methods and additionally some data is seasonally adjusted and others are not. One cannot compare values from different accounting methods and have that comparison be valid.
In a nutshell, the Balance of Payments accounting method is where they make a bunch of adjustments to not count imports and exports twice, the military moving stuff around or miss some additions such as freight charges. The Census basis is more plain raw data the U.S. customs people hand over which is just the stuff crosses the border. The 2005 chain weighted stuff means it was overall modified for a price increase/decrease adjustment in order to remove inflation and deflation time variance stuff.
Bottom line, you want just the raw data of what's coming into the country and going out, it's the Census basis and additionally the details are only reported in that accounting format. Additionally the per country data is not seasonally adjusted so watch out trying to add those numbers into the overall trade deficit. It's a statistical no-no to mix seasonal and non-seasonally adjusted numbers.
Here is March's trade deficit overview, data unrevised.
South Korea Trade Deficit Since FTA Balloons
So far, I don't have enough data to create a solid graph but Public Citizen noticed the data:
I'll make a point to start monitoring deficits per FTAs and do a large overview for it. I'd like to get a few more months of data from S. Korea, but this looks bad, as pointed out and was projected to happen.