
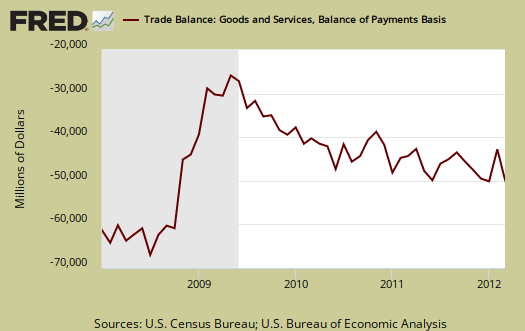
The U.S. March 2012 trade deficit jumped $6.41 billion to $51.83 billion in a month. This is a 14.1% monthly increase in the trade deficit. Exports increased $5.28 billion, a 2.9% increase from last month. Imports increased $11.69 billion, which is a 5.15% increase from February.
Q1 GDP's trade deficit percentage point contribution was -0.01. This is basically no effect on the 2.2% real growth reported. After much digging and frustration, we looked at trade data inputs into GDP where March data was estimated for the advance report. We found by inputs, annualized, exports would revise up $13 billion for Q1, yet imports would be revised upward by pretty much the same amount, $13 billion for the Q1 GDP revisions. This implies the BEA got it pretty much on target when they estimated the March trade deficit for the Q1 GDP report. Take this with a grain of salt for this is just the inputs into the GDP calculation. There are implicit price indexes, deflators and various what nots which go into figuring the trade component contributions and percentage changes for quarterly real GDP. But contrary to many press reports, we think this outrageous trade deficit will have no effect on the next GDP revision. That said, in terms of real jobs and other issues, the trade deficit is horrific!
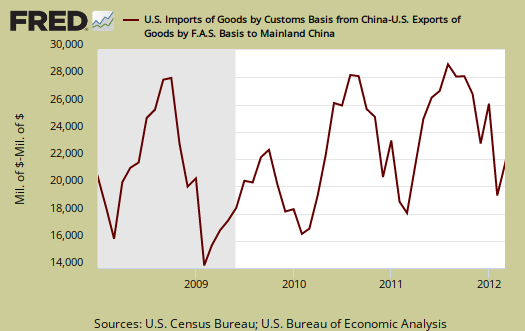
The China deficit alone was, -$21.672 billion, or 37.7% of the goods trade deficit and increased $2.3 billion from last month. This includes oil, is not seasonally adjusted and is on a raw customs accounting basis. This is no surprise since country data is not seasonally adjusted and China partially shut down in February due to their lunar holiday. For comparison's sake the not seasonally adjusted goods trade deficit by Census accounting methods was -$57.45 billion. China's never ending import barrage is highly cyclical as one can see in the below graph of the deficit with China.
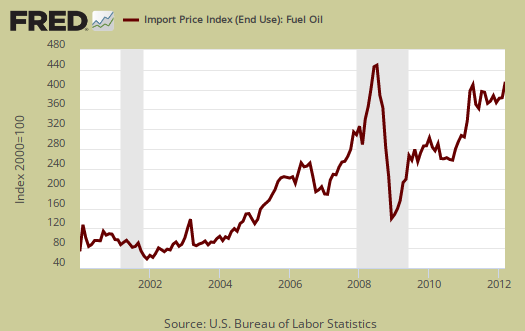
Oil or petroleum showed an end use trade deficit of -$28.58 billion, for March, an increase, 3.5%, from last month. Petroleum related end use was 42.9% of the goods trade deficit. Petroleum related imports from China as essentially non-existent.
The United States basically has two major ongoing problems with the trade deficit, Chinese goods and Oil imports. Below is the not seasonally adjusted import price index for oil fuel. The average price for a barrel of oil in March was a whopping $107.95. By volume, the U.S. imported 270,868,000 barrels of crude oil in March.
Below are imports vs. exports of goods and services. Notice how much larger imports are than exports, but also notice the growth, or rate of change between months of U.S. exports over time. To state the obvious, imports subtract from GDP and exports add.

Below is the list of good export changes from February to March, seasonally adjusted. Exports of goods increased $4.963 on a Census accounting basis, whereas the headline buzz is the BOP accounting method, or $4.74 billion. Exhibit 7 gives Census accounting method breakdown for exports. The U.S. exported $852 million more in fuel oil alone for March. The press is touting the $320 million increase in aircraft engine exports, but the real cause of the increase in exports is fuel oil. Oil drilling gear had a good month as well, with $308 million monthly increase in exports. Services export increases were $0.5 billion for March.
- Automotive vehicles, parts, and engines: +$0.356 billion
- Industrial supplies and materials: +$2.403 billion
- Other goods: +$0.407 billion
- Foods, feeds, and beverages: +$0.468 billion
- Capital goods: +$1.245 billion
- Consumer goods: +$0.083 billion
Below are the goods import monthly changes, seasonally adjusted. This is just unbelievable, the U.S. imported $1.094 billion more in computers in March and $993 million more in prescription drugs. We imported $616 million more in TVs and $321 million more in Cell phones. While the press touts the civilian aircraft engine export increase, we actually imported $384 million more in aircraft for March. Crude oil imports increased $1.497 billion and the net whopping Census accounting basis March increased was $11.13 billion.
- Industrial supplies and materials: +$2.472 billion
- Capital goods: +$3.481 billion
- Foods, feeds, and beverages: +$0.207 billion
- Automotive vehicles, parts, and engines: +$1.233 billion
- Consumer goods: +$3.250 billion
- Other goods: +$0.493 billion
The above is where American jobs went. Just looking over the various goods being imported that the United States once proudly made tells the story, we've exported the jobs and imported the resulting products. Anyone who says this isn't a problem is smoking crack, yet politicians keep signing more bad trade agreements! It's so bad, we ran a -$10 billion March trade deficit with Europe where labor and wages are comparable to the U.S.
Running a trade deficit in advanced technology is not a good sign for those jobs of tomorrow. The below report statistics are not seasonally adjusted. Notice how oddly worded the report text is, as if we cannot see the trade deficit in advanced technology increased in March?
Advanced technology products exports were $27.9 billion in March and imports were $35.1 billion, resulting in a deficit of $7.2 billion. March exports were $4.5 billion more than the $23.3 billion in February, while March imports were $5.9 billion more than the $29.2 billion in February.
Here is the breakdown with major trading partners, not seasonally adjusted. China is the worst trade deficit, as detailed above.
OPEC can be assumed to be oil and the OPEC nations are: Algeria, Angola, Ecuador, Iran, Iraq, Kuwait, Libya, Nigeria, Qatar, Saudi Arabia, United Arab Emirates, Venezuela.
The March figures show surpluses, in billions of dollars, with Hong Kong $3.0 ($3.1 for February), Australia $2.0 ($1.7), Singapore $0.9 ($0.7), and Egypt $0.2 ($0.2).
Deficits were recorded, in billions of dollars, with China $21.7 ($19.4), European Union $9.8 ($5.9), OPEC $9.1 ($6.4), Japan $7.1 ($7.0), Mexico $6.1 ($5.8), Germany $5.5 ($3.6), Canada $3.1 ($2.9), Venezuela $2.7 ($1.9), Ireland $2.1 ($2.2), Nigeria $1.0 ($0.9), Taiwan $0.7 ($0.8), and Korea $0.6 ($0.4).
Here is the BEA website for additional U.S. trade data, such as it is.
At this point, we might comment it seems almost intentional that trade data is presented to obscure the obvious, this country's trade deficit is just a never ending blood suck out of the U.S. economy. Sorry folks, but after 8 hours trying to chase down data points which should be front and center, I am not amused by government agencies obscuring data and changing accounting methods midstream so apples to apples comparisons become more difficult. We're in enough trouble as it is, we do not need facts hidden on top of our problems.
You might ask what are these Census Basis versus Balance of Payment mentioned all over the place? The above mentions various accounting methods so we're comparing Apples to Apples and not mixing the fruit. The trade report in particular is difficult due to the mixing of these two accounting methods and additionally some data is seasonally adjusted and others are not. One cannot compare values from different accounting methods and have that comparison be valid.
In a nutshell, the Balance of Payments accounting method is where they make a bunch of adjustments to not count imports and exports twice, the military moving stuff around or miss some additions such as freight charges. The Census basis is more plain raw data the U.S. customs people hand over which is just the stuff crosses the border. The 2005 chain weighted stuff means it was overall modified for a price increase/decrease adjustment in order to remove inflation and deflation time variance stuff.
Bottom line, you want just the raw data of what's coming into the country and going out, it's the Census basis and additionally the details are only reported in that accounting format. Additionally the per country data is not seasonally adjusted so watch out trying to add those numbers into the overall trade deficit. It's a statistical no-no to mix seasonal and non-seasonally adjusted numbers.
The Census is also getting into the graphing game with some nice pie charts breaking down exports by country, as well as a chart showing petroleum as an overall percentage of the trade deficit.
Here is February's trade deficit overview, data unrevised.
wondering howU.S.exports oil while gas prices soar?
We've covered this previously but basically big oil is fixing gas prices. Ritholtz put together numerous articles together to give you the nasty details.
pretty rare I criticize government statistics
But that said, there are certain things which really give insight into the U.S. economy as a whole and on this report, there is missing data, missing from the public, that is key critical to examining the trade deficit, in part due to the many different accounting methods and data presentation formats.
Then, I take real issue with the Census gathering monthly data and no clear, thoroughly explained so people with statistical backgrounds can easily follow, methods, including formulas to show how those inputs are normalized and adjusted, eventually going into NIPA and GDP, GNP calculations. And no, massive PDFs that are barely searchable in a NIPA handbook is simply not a clear, concise, method presentation. That's a graduate course.
That's not cool folks, it should not take a rocket scientist or a day of digging around to find one data point. One should not have to "reverse engineer" a data point to figure out what kind of format that data point is presented in (simple percentage, simple annualized, annualized percentage).
The Fed ain't clear in this either. The consumer credit report looks like they are literally truncating the press release data points, and it's only if one diggs around in the historical data can one find the full values. Come on people, the std. is rounding, why are these data points presented as truncated? At least explain why, come on here. The general public shouldn't have to hand over a fiver, consult an oracle, just to follow your statistical releases.
While I'm a data nut, good at ferreting out the series from government sources, I keep running into "missing data" or missing metrics on trade especially. Yes, of course this is extremely complex, we have all sorts of crap going across the borders, some re-entering, some imports are raw materials which will become exports, some are partial products....yes, it's a MASSIVE accounting and data problem.
That said, part of this is Congress's fault, lack of funding but another part of this is hiring bad I.T., pure and simple, plus obscure, bad methods presentation. It's 2012 and the public should easily have the database tools to dig out, quickly, data details and it all should be freely accessible to the public. Methods, including actual formulas used for data presentation should be clearly and concisely stated, with all equation variables clearly defined.
For example, one thing I often have to do is actually figure out which annualization method is used. A report will claim x data is annualized, well, by what method specifically, simple continuous, constant scaled, curve fitting w.r.t. x rule, complex continuous, what?
Then, while data is marked usually by what accounting method, uh, so when one has to dig through pages of definitions and most importantly while one data point is in one accounting methods, others are presented in a different one.
How many times have we seen the press mix accounting methods, NSA, SA data and report that as "fact"? My favorite is some bencmarks are regression adjusted, others are simply "tacked on" to the last time period of data? UGH!
Case in point country data vs. crude oil/petroleum all by NAICS codes, only then can we compare say China exporting NAICS based end use products to say OPEC exporting NAICS based end products to drill further into country of origin.
Services details are almost non-existent, thank you BEA and here is where offshore outsourcing resides. How are we supposed to know the details of say I.T. "imports" from country of origin vs. "call center" imports from country of origin to know what is really going on and tying those data points to real world policy?
Perhaps it is not desired to be known, so one cannot compare the specifics of China and advanced R&D coming in as partial imports and services?
Just examples of my frustration with government statistics and yes, this is a rant!
Seriously and we haven't even touched upon the BLS and labor market lack of data points yet in this comment.
A database that takes 20 minutes plus some knowledge of java errors to even pull out one data series is simply unacceptable design.
Not publishing data series used to compute real values, and those real values clearly defined by what time index and so on is also unacceptable. Good freakin' God, there is a huge difference between CPI-U, CPI-U-RS, PCEPI, MXP et. al. That's ridiculous for "real" then has major scaling differences.
Another major issue are price indexes and deflators generally. Come on BEA specifically, you need to clearly and concisely, show the details, plus show the formulas with definitions, and the calculation steps, in mathematics, not some jumbled .txt format at least in a pdf.
Price deflators man, gez, we can do almost anything with those damn things from hide hidden real costs and intermediate inputs to over-inflate economic growth.
This ain't cool to be very specific, explain clearly, in great detail the hows and whys of price indexes, but with the mathematics additionally.
It's no wonder the press gets these economic releases so wrong, but if these Journalists cannot read this stuff, how do they expect regular people to even have a feel for what real GDP means?
We, as taxpayers, as citizens are supposed to have access to this information. While I don't expect the government statistical agencies to hold the hands of the public and explain to the level of high school math, I sure do expect details most PhDs understand to be clearly presented, at that level, and publicly available.
We'll go pick on the BLS and the USCIS, DHS, CBO and GAO for another day, but they also have their come upping's when it comes to full data releases, use of the modern world and methods for data aggregation, presentation and explanation.
EOM - rant off