
Q1 2012 real GDP showed 2.2% annualized growth.. This article overviews and graphs the BEA statistical release for first quarter gross domestic product.
Q1 GDP saw much less of an increase in private inventories build up, part of investment, an increase in personal consumption and a not to be believed increase in exports.
As a reminder, GDP is made up of: where Y=GDP, C=Consumption, I=Investment, G=Government Spending, (X-M)=Net Exports, X=Exports, M=Imports*.
The below table shows the percentage point breakdown of individual GDP components contribution to overall GDP. The difference, or spread, between Q4 and Q1 components is by percentage points.
| Comparison of Q4 2011 and Q1 2012 GDP Components | |||
|---|---|---|---|
|
Component |
Q4 2011 |
Q1 2012 |
Spread |
| GDP | +2.96 | +2.20 | -0.76 |
| C | +1.47 | +2.04 | +0.57 |
| I | +2.59 | +0.77 | -1.82 |
| G | –0.84 | –0.60 | +0.24 |
| X | +0.37 | +0.73 | +0.36 |
| M | –0.63 | –0.74 | -0.11 |
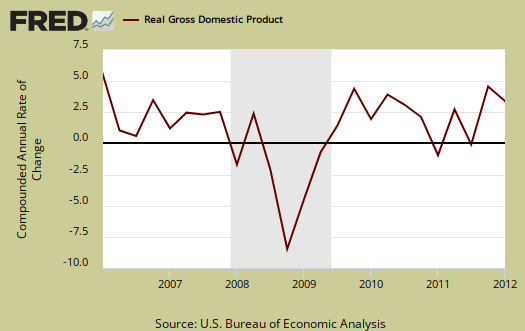
Changes in private inventories are part of I and contributed 0.59 percentage points to overall GDP. This is a huge change from Q4 where changes in private inventories added 1.81 percentage points, or 61.2% of Q4 GDP growth. Q1 2012 saw changes in private inventories be 29.5% of overall real GDP growth. Companies increase inventories when they believe demand for their products will be picking up soon. Inventories can also build up when producers made more stuff they thought would sell.....but didn't, although in this case, producers will later be out to reduce that excess inventory. We can see the massive shedding of inventory in 2009 in the below graph.

Yes folks, government consumption and investments does add to U.S. economic growth in spite of the rhetoric one hears. This quarter government subtracted off -0.60 percentage points, or -30% from Q1 GDP growth. Federal spending subtracted off –0.46 percentage points and state & local spending cuts resulted in a negative –0.14 percentage point contribution to GDP. Federal national defense spending was the biggest drop, with a –0.44 percentage point GDP contribution. Below is the percentage quarterly change of government spending, adjusted for prices, annualized.

Below the the St. Louis FRED graph for C, or real personal consumption expenditures of the above GDP equation. As we can see from the above component breakdowns, PCE, or C in the above equation, did increase by over half, 0.57, a percent point contribution from Q4 to Q1.

Below is the breakdown in C or real PCE annualized change. The forth quarter PCE percentage point breakdown was a +0.57 percentage point contribution in services with most of that being household consumption or 0.48. Housing and utilities subtracted -0.23 percentage points and financial products added +0.23 percentage points in the breakdown of services.
Within PCE (C), goods added +1.47 percentage points with durable goods being most of goods, or a +1.13 percentage point contribution to GDP. Notice when times are tough, durable goods (bright red in the below graph) consumption drops. Where people spent their money was motor vehicles and parts, a +0.68 percentage point contribution to GDP. Gasoline and other energy goods was –0.14 percentage points of Q1 GDP and yes these are adjusted for inflation using CPI. In real dollars, or having price increases removed, the BEA is claiming gasoline and energy goods (not household utilities), were consumed less in Q1. What this strange percentage point decline tells us is people used less gasoline and no surprise since prices have gone through the roof. PCE is often revised from the advance report as receipts and reports are collected. Below is PCE with the quarterly annualized percentage change breakdown of goods versus services (maroon).

Below are real final sales of domestic product, or GDP - inventories change. This gives a better feel for real demand in the economy. This is because while private inventories represent economic activity, the stuff is sitting on the shelf, it's not demanded or sold. Q1 Real final sales increased 1.6% for Q1 and in Q4 real final sales were just 1.1%.

Below are net exports, or the trade deficit, in real chained dollars, by quarter and up to Q1 2012. Imports subtract from gross domestic product.

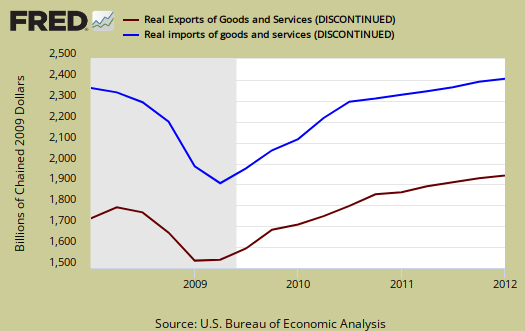
The below graph shows real imports vs. exports. We scoffed at the export percentage point contribution simply because trade data is almost always revised from the advance GDP report as Census trade data comes in from customs. The monthly trade numbers only go up to February, which showed a sharp decline in the deficit, but for that month, which covered the Chinese holiday. March 2012 trade data was estimated for the advance GDP report. We don't buy it that exports grew to such an extent and imports so little. Last quarter exports were revised heavily down as the real trade raw customs data came in. We believe this part of the advance GDP report will be significantly revised similarly. Here it is, for now.
Gross domestic purchases are what U.S. consumers bought no matter whether it was made in Ohio or China. It's defined as GDP plus imports and minus exports or using our above equation: where P = Real gross domestic purchases. Real gross domestic purchases increased 2.1% for Q1, whereas Q4 had a 3.1% increase. Exports are subtracted off because they are outta here, you can't buy 'em, but imports, as well a know all too well, are available for purchase at your local Walmart. When gross domestic purchases exceed GDP, that's actually bad news, it means America is buyin' imports instead of goods made domestically. As we can see, GDP and gross domestic purchases are almost equal, but improved from Q4 to Q1.
Below are the percentage changes of Q1 2012 GDP components, from Q4. Realize there is a difference between percentage change and percentage point change. Point change adds up to the total GDP percentage change and is reported above. The below is the individual quarterly percentage change, against themselves, of each component which makes up overall GDP.
- C = +2.9%
- I = +6.0%
- G = –3.0%
- X = +4.3%
- M = +5.4%
The BEA's comparisons in percentage change breakdown of 2nd quarter GDP components are below. Changes to private inventories is a component of I.
C: Real personal consumption expenditures increased 2.9 percent in the first quarter, compared with an increase of 2.1 percent in the fourth. Durable goods increased 15.3 percent, compared with an increase of 16.1 percent. Nondurable goods increased 2.1 percent, compared with an increase of 0.8 percent. Services increased 1.2 percent, compared with an increase of 0.4 percent.
I: Real nonresidential fixed investment decreased 2.1 percent in the first quarter, in contrast to an increase of 5.2 percent in the fourth. nonresidential structures decreased 12.0 percent, compared with a decrease of 0.9 percent. Equipment and software increased 1.7 percent, compared with an increase of
7.5 percent. Real residential fixed investment increased 19.1 percent, compared with an increase of 11.6 percent.X & M: Real exports of goods and services increased 5.4 percent in the first quarter, compared with an increase of 2.7 percent in the fourth. Real imports of goods and services increased 4.3 percent, compared with an increase of 3.7 percent.
G: Real federal government consumption expenditures and gross investment decreased 5.6 percent in the first quarter, compared with a decrease of 6.9 percent in the fourth. National defense decreased 8.1 percent, compared with a decrease of 12.1 percent. Nondefense decreased 0.6 percent, in contrast to an increase of 4.5 percent. Real state and local government consumption expenditures and gross investment decreased 1.2 percent, compared with a decrease of 2.2 percent.
Motor Vehicles GDP contribution was an astounding 1.12 percentage points. Compare that to computer final sales, which was only 0.05 percentage points of Q1's 2.2% GDP. Motor vehicles are different from personal consumption, or C sub-component auto & parts, this is an overall separate index. Motor vehicles, computers are bought as investment, as fleets, in bulk, by the government and so forth.
Residential fixed investment was 0.40 of Q1 GDP by percentage points. Below is the raw totals on residential investment. If one could ever see the housing bubble and then it's collapse in terms of economic contributions, the below graph is it, although Q4's residential fixed investment GDP percentage point contribution was 0.25.

Private, or not from the government, fixed investment was only 0.18 percentage points of Q1 GDP. Nonresidential fixed investment was –0.22 percentage points with structures, a sub-component of nonresidential fixed investment, giving a –0.35 percentage point contribution. That would be commercial real estate, i.e. facilities leased or purchased.

The price index for gross domestic purchases, was 2.4% for Q1. Q4's gross domestic purchases price index was 1.1%. This index measures price increases in the U.S. In other words, there was way more inflation than last quarter. Core price index, or prices excluding food and energy products, increased 2.2% for Q1.
In current dollars, not adjusted for prices, GDP, or the U.S. output, is $15.4618 trillion, a 3.8% increase from last quarter. Applying the price indexes, or chained, real 2005 dollars, Q1 2012 GDP was $13.5024 trillion. Both numbers are annualized.

Here is the overview for the Q4 2011 GDP, 2nd revision report, text unrevised, graphs are updated.
* In Table 2, the BEA reports GDP contribution components with their equation sign. If durable goods for example, decreased over the quarter or year, it is reported as a negative number. Imports, from the GDP equation, are already a negative for that is not something produced domestically. A negative sign implies imports increased for the time period and a + sign means the change in imports decreased. Or, from the GDP equation: . Confusing but bottom line exports add to economic growth, imports subtract.
Inflation
I guess these stats do not take into account the effect of inflation. According to articles that reference Shadow Stats, if inflation is accounted for US economic growth is not only slowing, it’s going backwards at a rate of negative 2.2% with all the attendant consequences of a contracting economy and incomes.
If you tell people lies long enough they will believe them until they are rudely confronted with reality. The question is when will that reality dawn on the majority of the population.
inflation w.r.t. GDP
Price deflators and price indexes are controversial, questioned. I've only gone through the NIPA handbook for some definitions, but real means those price deflators have been applied. If you can get enough details on why shadowstats says that, i.e. which price deflator and why. Myself, I can't just say "shadowstats says" without seeing the assumptions and specifics. The GDP report uses CPI, a price deflator for PCE over all, and individual price indexes for different GDP components.
I don't see how any of them could give negative GDP growth but I sure can see how they could be skewed on real GDP. Trade is one of the worst and I haven't been able to directly apply the indices to get real GDP components from the monthly trade reports.
One thing that maybe I should amplify more, 2% GDP growth means "treading water", it takes about 2% quarterly growth just to maintain, so that is somewhat illusionary.
I'm thinking of writing something up about price indexes. They are confusing as hell, where they originate, what kind of inputs go into them and it's a real dig into the obscurity of the BEA to even figure that point out.
Shadowstats loves to point out inflationary metrics are way too low, use substitute when it's not really valid and so on, so he's probably going off of that, but nominal GDP when positive, is divided by these price indexes to get to real values.