
The Federal Reserve Industrial Production & Capacity Utilization report shows a 0.3% increase in industrial production. Manufacturing alone grew, a 0.4% gain for the month, while utilities slid down by -1.4%. Mining was up 0.8%. Industrial production finally surpassed pre-recession levels this month. The G.17 industrial production statistical release is also known as output for factories and mines. The graph below shows industrial production index.
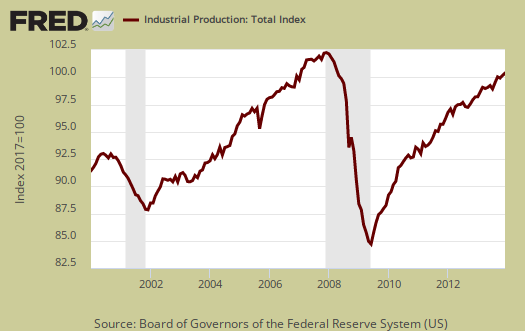
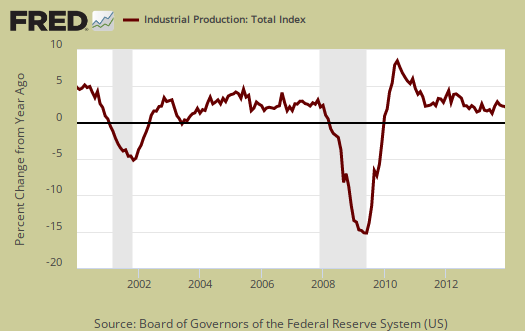
Total industrial production has increased 3.7% from a year ago. The press headline claim industrial production has the strongest annual gain since 2010 is false. Really industrial production is just recovering to six years ago 2007 levels for the total index. Currently industrial production is just 0.9 percentage points above December 2007. Below is graph of overall industrial production's percent change from a year ago. The Federal Reserve gives long term averages but economic malaise has been going on so long, 2008-2012 are part of those averages now.
Here are the major industry groups industrial production percentage changes from a year ago.
- Manufacturing: +2.6%
- Mining: +6.6%
- Utilities: +7.6%
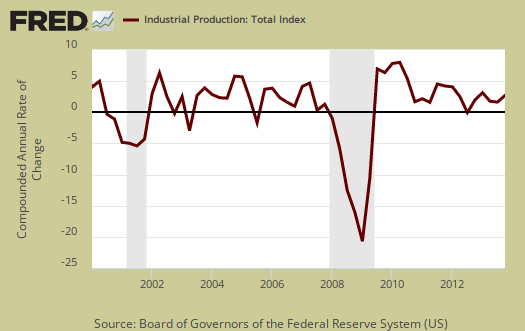
The 4th quarter for Industrial production is starting to shape up to be not bad, with an overall annualized 6.8 % increase and this is the biggest quarterly gain since Q2 2010. Industrial production does have some very loose correlation to GDP components. Yet, Q4's showing is a positive sign for economic growth. The below graph is the industrial production index by quarters, up to Q4 2013.
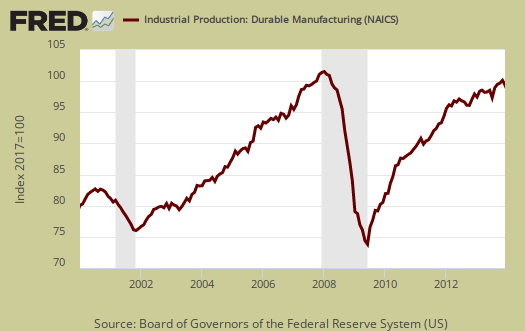
Manufacturing output is still 3.1 percentage points below it's December 2007 peak and -1.5 percentage points below the long run average. Generally speaking factory output is by no means healthy. Below is a graph of just the manufacturing portion of industrial production.

Within manufacturing, durable goods increased 0.1% for the month and the growth was 8.8%, annualized, for Q4. Primary metals, electrical equipment, appliances. motor vehicles & parts output all had 1.5% monthly gains. Machinery and wood products slammed down by -2.0%.
Nondurable goods manufacturing increased by 0.9% for the month. Nondurables also had a reasonable 4th quarter, with an annualized increase of 4.1% for Q4.

Mining has really grown in the United States, primarily on oil and gas extraction and this month is no exception, with a 0.8% monthly increase and for the year has increased 6.6%. Mining is also fueling the North Dakota economic miracle.

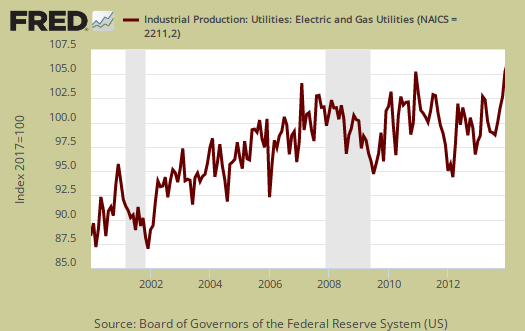
Utilities shot back up, which is a potentially good sign for the overall economy. For Q4 utilities output increased 18.6% annualized after a Q3 decline of -6.4% Utilities can also be impacted by unusual weather and as we can see in the below graph, utilities generally swing on a month to month basis.
There are two reporting methodologies in the industrial production statistical release, market groups and industry groups. Market groups is output bundled together by market categories, such as business equipment or consumer goods. Industrial output is by NAICS codes and is for all manufacturing, or all types of durable goods manufacturing*. Below is the Fed's description of Market groups from the report and their monthly percent changes. Looks like automotive is the bright spot in the otherwise ho hum industrial production figures.
The production of consumer goods rose 0.5 percent in December, its fifth consecutive monthly increase, and was 3.6 percent higher than its level in December 2012. The index advanced at an annual rate of 8.8 percent in the fourth quarter of last year. Durable consumer goods output rose 1.1 percent in December, with substantial gains in the indexes for automotive products; home electronics; and appliances, furniture, and carpeting. For the fourth quarter, the output of durable consumer goods expanded at an annual rate of 14.7 percent, as the indexes for all of its major components increased briskly. The output of nondurable consumer goods moved up 0.3 percent in December: Gains for foods and tobacco, for clothing, and for paper products more than offset decreases for chemical products and for consumer energy products. For the fourth quarter, the index for non-energy consumer nondurables moved up at an annual rate of 2.7 percent while the index for consumer energy products jumped more than 20 percent.
The output of business equipment moved down 0.5 percent in December after having decreased 0.3 percent in November; declines for information processing equipment and for industrial and other equipment more than offset a gain for transit equipment. For the fourth quarter, the index for business equipment rose at an annual rate of 3.7 percent; all of its major components registered gains, but the advance of 8.5 percent for transit equipment was substantially larger than the increases for the other categories.
The index for defense and space equipment was unchanged in December, but it increased at an annual rate of 7.5 percent in the fourth quarter. Output in December was 2.2 percent above its level of a year earlier.
Among nonindustrial supplies, the production of construction supplies moved up 0.4 percent in December—its seventh consecutive monthly gain—and was 4.4 percent above its year-earlier level. For the fourth quarter, the index increased at an annual rate of 7.2 percent. The output of business supplies gained 0.3 percent in December—its sixth consecutive monthly gain—and increased at an annual rate of 5.4 percent in the fourth quarter.
Capacity utilization, or of raw capacity, how much is being used, for total industry is 79.2%, a 0.1 percentage point monthly increase. How much plants are utilized is now 1.0 percentage points below the average from 1972 to 2012. Capacity utilization has increased 1.4 percentage points from a year ago. Manufacturing capacity utilization is now 77.2% and is 0.8 percentage points higher than a year ago. Mining capacity utilization is 90.2% and is up 1.8 percentage points from a year ago. Utilities use of it's capacity is 80.1% and this is an increase of a whopping 5.0 percentage points from a year ago.
Capacity utilization is how much can we make vs. how much are we currently using, of what capacity is available now, or output rate. Capacity utilization is also called the operating rate. Capacity utilization is industrial production divided by raw capacity.

Capacity growth is raw capacity and not to be confused what what is being utilized. Instead, this is the actual growth or potential to produce. Capacity is the overall level of plants, production facilities, and ability to make stuff, that we currently have in the United States. Capacity growth overall has increased 1.8 percentage points from a year ago, the same as the previous two months Below is the capacity growth increase from a year ago of the subcategories which make up industrial production.
- Manufacturing: +1.6%
- Mining: +4.5%
- Utilities: +0.8%
Now we need to make clear how raw industrial capacity has simply flatlined since 2000. This is the facilities, the plants, the industrial capabilities of the United States. Below is a graph of total industrial capacity and this includes manufacturing, logging, mining, utilities and publishing industries. Traditional manufacturing, as defined by NAICS codes is in red. What we see is strong growth until about the year 2000, then raw capacity flatlines. This is a real economic problem, it means America's capacity to output has seriously diminished. We also believe the plants, facilities, factories which should be built in America are instead being built in China, Brazil, India and other offshore outsourcing destination countries by U.S. multinational corporations. The little guy manufacturers and even the U.S. oil production increase is obviously not making up the difference.
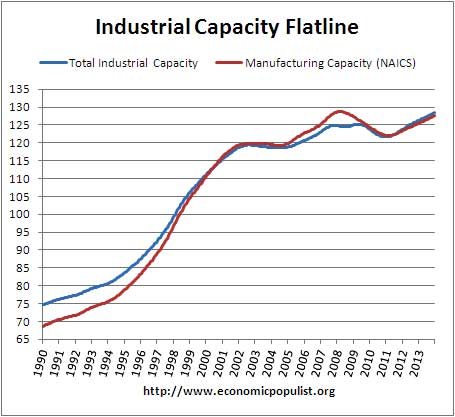
For the 1990's, industrial capacity increased 49% while manufacturing capacity increased 61%. Year 2000 hits and capacity just dies. Even if we take the next 13 years, from December 1999 to present, industrial capacity has only increased 16% with manufacturing by itself slightly less. While from 2000 includes two recessions, still we can see capacity just truly has shown no growth in comparison to before year 2000. This is a real problem for the future of America. Without building the facilities, factories, plants to increase output, the United States potential economic growth is automatically stunted. This is also why Bernanke mentioned capacity being a real economic problem in his last press conference.
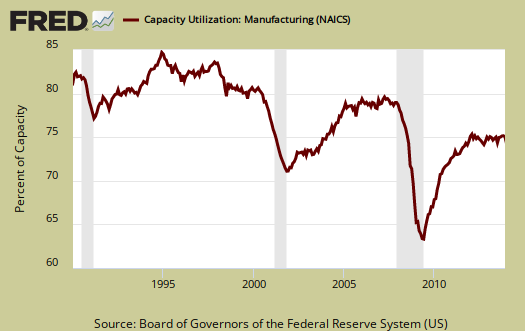
According to the report for 2012, manufacturing uses 77.4% of capacity, with durables about 39.7%. Utilities use 9.9% and mining 12.7% in 2012 (rounded) to give a ratio of manufacturing vs. mining and utilities in terms of capacity. High tech uses 3.7% of total industrial production capacity. Below is the Manufacturing capacity utilization graph, normalized to 2007 raw capacity levels, going back to the 1990's. Too often the focus is on the monthly percent change, so it's important to compare capacity utilization to pre-recession levels and also when the economy was more humming.
Here are our previous overviews, only graphs revised. The Federal Reserve releases detailed tables for more data, metrics not mentioned in this overview. If you are baffled by what crude, finished mean from the G.17 report, read these stages of production definitions. Stages of production have implications for exports and imports. Finishing industrial production implies goods for final sale and thus what kind of output one will see for the month. From the report:
Capacity utilization rates in December for industries grouped by stage of process were as follows: At the crude stage, utilization increased 0.3 percentage point to 88.7 percent, a rate 2.4 percentage points above its long-run average; at the primary and semifinished stages, utilization was unchanged at 77.9 percent, a rate 3.1 percentage points below its long-run average; and at the finished stage, utilization edged up 0.1 percentage point to 76.3 percent, a rate 0.8 percentage point below its long-run average.
*From the Federal Reserve definition details:
Market groups consist of products and materials. Total products are the aggregate of final products, such as consumer goods and equipment, and nonindustrial supplies (which are inputs to nonindustrial sectors). Materials are inputs in the manufacture of products. Major industry groups include three-digit NAICS industries and aggregates of these industries-for example, durable and nondurable manufacturing, mining, and utilities./blockquote>
Recent comments