
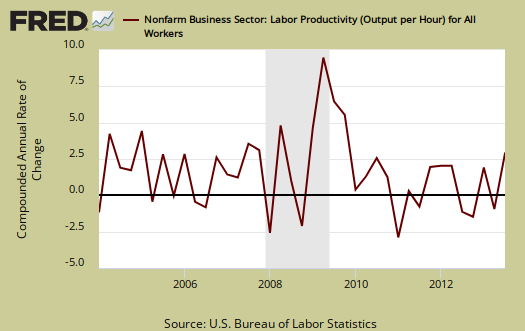
The BLS Productivity & Costs report for Q3 2013 shows labor productivity increased a whopping annualized 3.0%. This is the largest increase in productivity since Q4 2009. Output increased 4.7% and hours worked increased 1.7%. Unit Labor costs dropped by -1.4% in Q3 2013. The reason labor productivity surged was increased economic output while worker hours did not increase as much. Below is a graph of the quarterly change in labor productivity.
The basic equation for labor productivity is: , where
is the total output of industry and
stands for labor.
Output can be thought of what is produced from the fruits of labor. Examples would be the cars which come off the assembly line and burgers & fries being served up at McDonald's. Here is the BLS labor productivity formula:
Labor productivity is calculated by dividing an index of real output by an index of the combined hours worked of all persons, including employees, proprietors, and unpaid family workers.
, or Labor, is measured in hours only. Nonfarm Business Output directly correlates to real GDP, minus the government, farms,all of those nonprofits and our infamous, often illegal nannies and gardeners, and equivalent rent of owner occupied properties. The output, or
is about 74% of real GDP reported. Farms, if you can believe this, only represent about 1% of output. Labor productivity is reported as annualized figures and both indexes are normalized to the year 2009. The main productivity numbers above are all business, no farms, where labor costs have a high ratio, about 60%, to output. These productivity statistics are referred to as nonfarm business.
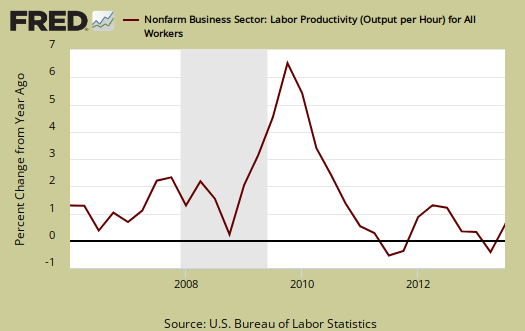
From Q3 2012, a year ago, annual productivity increased 0.3%, output increased 2.1%, and hours worked rose by 1.8%. Changes from a year ago show a little less worker squeeze in terms of hours worked. Labor productivity changes from a year ago is shown in the below graph.
BLS defines unit labor costs as the ratio of hourly compensation, to labor productivity, where is compensation
represents hours worked as above, or:
For more formula definitions see the BLS handbook. One can also view unit labor costs as the ratio of total worker financial compensation to economic output, adjusted for inflation. Below is the report description of the ratio relationship:
BLS defines unit labor costs as the ratio of hourly compensation to labor productivity; increases in hourly compensation tend to increase unit labor costs and increases in output per hour tend to reduce them. Real hourly compensation is equal to hourly compensation divided by the consumer price series.
Graphed below are unit labor costs, compounded annual rate, percent change. Nonfarm business Unit labor costs dropped by by -1.4% for Q3 2013. From a year ago, Q3 2012, labor costs are are up 2.1%. Decreases in unit labor costs imply compensation is not keeping up with economic output. Increased productivity, or output per hour, for the same $$ paid to workers should show lower unit labor costs. These figures show labor arbitrage is alive and well in America for productivity is calculated by actual hours. Technology does play a hidden role in labor productivity. One element seemingly not recognized are salaried workers who are under exempt status. Their hours are calculated as 40 a week, when in reality people on salary are more and more working 80 hours per week.

Graphed below are unit labor costs, indexed to 2005. We can see the decline correlating to the Great Recession. One can also see some recovery in the last couple of years, but declines are not good news for workers generally speaking.

Real hourly compensation is wages adjusted for inflation. Real hourly compensation is equal to hourly compensation, defined above, divided by a special inflation series called the consumer price series*,
In terms of real dollars, adjusted for inflation, we have a revised annualized -1.0% decline in real hourly compensation for Q3 2013, non-farm businesses. In comparison to Q3 2012, real hourly compensation increased a measly 0.8%. This means wages finally kept up with inflation,but barely and inflation has been beyond tame for 2013. Below are quarterly changes to hourly compensation, adjusted for consumer prices.

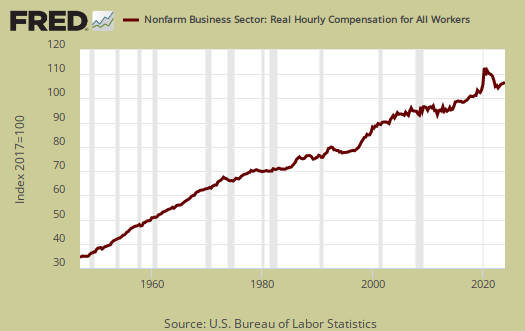
Below is a historical graph of real hourly compensation for nonfarm business. What this shows is worker squeeze. We see a steady increase up until 1980 and then starting with year 2007, we see a complete flat line. As productivity soars, clearly workers are getting less and less of their share.
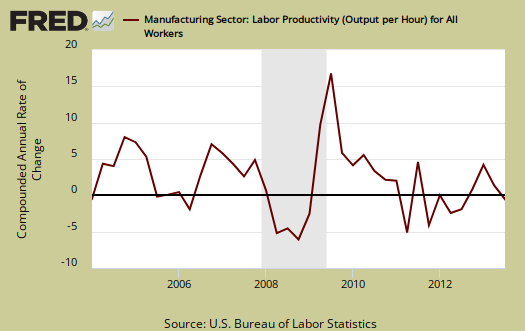
The BLS also reports separately on manufacturing productivity, but uses a different calculation method than the one for business productivity. Don't think one can subtract manufacturing from business and get services productivity, the two are not the same. Manufacturing is sales, removing duplicates, adjusting for prices and output () is correlated to shipments and the industrial production. indexes. Hours are hours like above. The report, p. 5, has the manufacturing productivity measurement details.
Manufacturing productivity decreased by -0.1%, for Q3 2013. Manufacturing output grew by 1.1%, while hours worked increased 1.2%. The Q3 results are a rarity. Since Q3 2012, manufacturing productivity increased 2.2% as output increased by 2.3% and hours worked showed a measly 0.1% increase. Only in the last couple of months has manufacturing shown some real employment growth, so the above correlates to payrolls and the manufacturing ISM indicators.
Manufacturing unit labor costs increased 1.3% for Q1 2013. From a year ago, manufacturing unit labor costs are down by -0.2%.
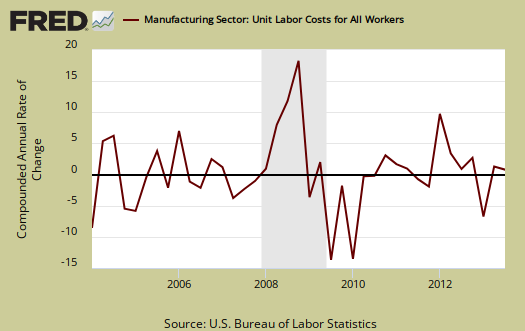
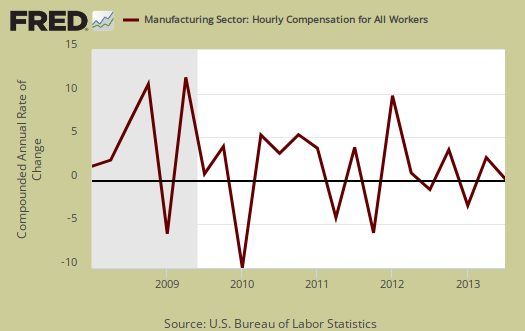
Compensation for manufacturing workers increased 1.3% for the quarter and from a year ago has increased 0.4%.
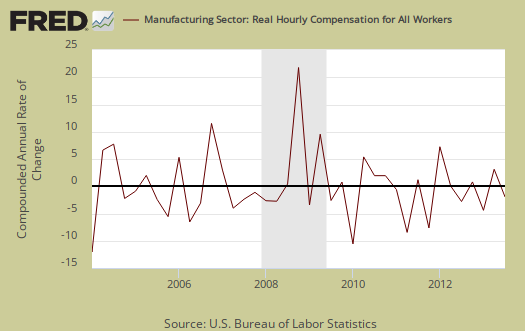
Yet real wages in manufacturing are as usual in the pits. Q3 2013 real compensation (wages) in manufacturing declined by -1.3%. From Q3 2012, real hourly compensation for manufacturing workers at least has increased by 0.4%, which means they barely kept up with inflation. Manufacturing wages have been on a tear in declines and note inflation has been very tame for 2013. .
For Q3 2013, durable good manufacturing productivity grew by 1.1%, output increased 3.1% and hours worked increased by 1.9%. Durable goods labor unit costs dropped -0.8%, compensation increased by 0.3%, which implies real compensation plunged by -2.3%. Graphed below is the durable goods manufacturing real hourly compensation index and marvel at the decline over time.
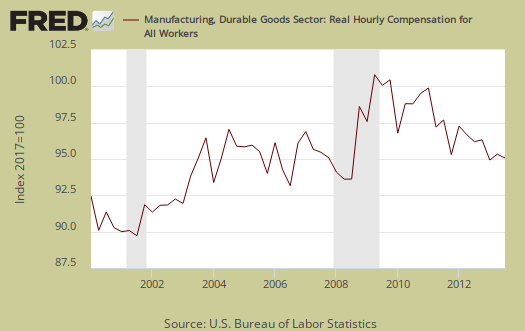
Unit labor costs in durable goods shows the decline of the American worker for they are returning to their lows. Unit labor costs show real output per hour. Durable goods workers are producing more and more and U.S. workers are getting less reward.

Nondurable manufacturing productivity decreased by -1.1% on an output decline of -1.1%. Hours were unchanged. Nondurable manufacturing unit labor costs increased by 4.0%, hourly compensation also increased, 2.9% and real hourly compensation increased by 0.3%. Nondurable goods might be harder to offshore outsource and the reason we see some wages for Q3.
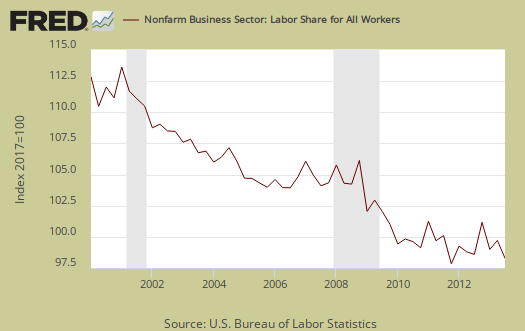
What you see these days in productivity is not what it appears. The press will claim increased productivity is a great thing, and maybe that's true for corporate profits, but it's clearly not translating into wages and jobs for workers. Labor share is a measure of how much of the economic pie goes to workers. If labor share increases, this implies labor is benefiting from increased economic growth. When the compensation to productivity gap widens, labor share falls and that means workers are not reaping the economic rewards of their sweat and toil.
Below is labor market share for nonfarm business which shows workers overall are getting less and less of the productivity pie.
Overall, the labor productivity statistics for Q3 2013 look like the American worker shifted into static mode from declines and most of the increases were due to increased output vs. dramatic worker squeeze, which is how it should be. Still America desperately needs increased real wages and that part of any recovery looks like not to happen anytime soon, unless of course deflation suddenly appears.
* The BLS productivity statisticians use CPI-U-RS, an unpublished inflation research metric, for the consumer price series. This consumer price series seems to flatten inflation, thus make the decline in U.S. wages less, although when normalized to a base year of 2009 the two series are the same for all practical purposes. The implicit price deflator, applied to nonfarm business output (productivity), is from the BEA. The CPS and the price deflator are all to remove inflation effects from the productivity statistics.
Recent comments