
Inventories data came out today and showed we have the biggest decline in inventories in history of the index, 1.5%. Here is the inventory to sales ratio graph, which is actually good. The more manufacturers run out of stuff on the shelves with new orders, the more they have to make stuff and hire people to make the stuff.
Sales. The U.S. Census Bureau announced today that the combined value of distributive trade sales and manufacturers’ shipments for August, adjusted for seasonal and trading-day differences but not for price changes, was estimated at $989.6 billion, up 1.0 percent (±0.2%) from July 2009 and down 15.1 percent (±0.4%) from August 2008.
Inventories. Manufacturers’ and trade inventories, adjusted for seasonal variations but not for price changes, were estimated at an end-of-month level of $1,311.4 billion, down 1.5 percent (±0.1%) from July 2009 and down 13.3 percent (±0.4%) from August 2008.
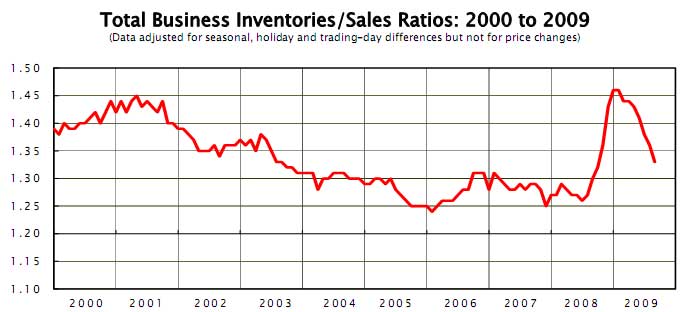
Inventories/Sales Ratio. The total business inventories/sales ratio based on seasonally adjusted data at the end of August was 1.33. The August 2008 ratio was 1.30.
EconomPic Data points to a inventory correction as in cliff dive but believes that an all time low in inventories along with new orders should give credence to a major Q3 2009 GDP increase.
Recent comments